Immigrants from St. Vincent and the Grenadines vs Scottish Disability Age Under 5
COMPARE
Immigrants from St. Vincent and the Grenadines
Scottish
Disability Age Under 5
Disability Age Under 5 Comparison
Immigrants from St. Vincent and the Grenadines
Scottish
0.79%
DISABILITY AGE UNDER 5
100.0/ 100
METRIC RATING
2nd/ 347
METRIC RANK
1.6%
DISABILITY AGE UNDER 5
0.0/ 100
METRIC RATING
307th/ 347
METRIC RANK
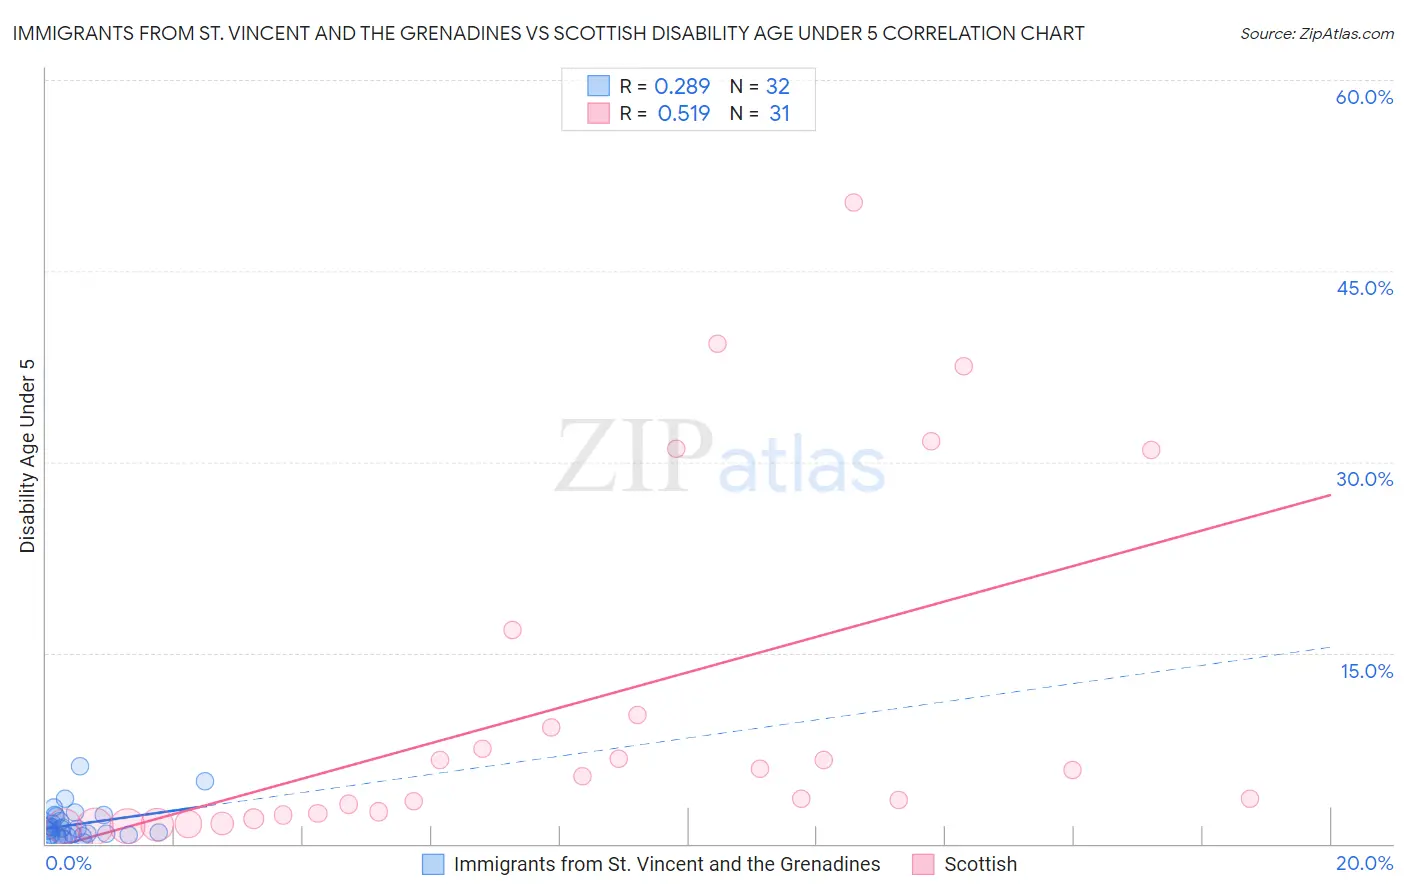
Immigrants from St. Vincent and the Grenadines vs Scottish Disability Age Under 5 Correlation Chart
The statistical analysis conducted on geographies consisting of 43,198,055 people shows a weak positive correlation between the proportion of Immigrants from St. Vincent and the Grenadines and percentage of population with a disability under the age of 5 in the United States with a correlation coefficient (R) of 0.289 and weighted average of 0.79%. Similarly, the statistical analysis conducted on geographies consisting of 258,599,259 people shows a substantial positive correlation between the proportion of Scottish and percentage of population with a disability under the age of 5 in the United States with a correlation coefficient (R) of 0.519 and weighted average of 1.6%, a difference of 109.2%.
Disability Age Under 5 Correlation Summary
| Measurement | Immigrants from St. Vincent and the Grenadines | Scottish |
| Minimum | 0.086% | 1.4% |
| Maximum | 6.1% | 50.4% |
| Range | 6.0% | 49.0% |
| Mean | 1.5% | 10.8% |
| Median | 1.1% | 5.3% |
| Interquartile 25% (IQ1) | 0.66% | 2.3% |
| Interquartile 75% (IQ3) | 2.0% | 10.1% |
| Interquartile Range (IQR) | 1.3% | 7.8% |
| Standard Deviation (Sample) | 1.3% | 13.7% |
| Standard Deviation (Population) | 1.3% | 13.4% |
Similar Demographics by Disability Age Under 5
Demographics Similar to Immigrants from St. Vincent and the Grenadines by Disability Age Under 5
In terms of disability age under 5, the demographic groups most similar to Immigrants from St. Vincent and the Grenadines are Vietnamese (0.81%, a difference of 3.2%), Immigrants from Armenia (0.76%, a difference of 4.1%), Immigrants from Uzbekistan (0.85%, a difference of 7.9%), Immigrants from Bangladesh (0.85%, a difference of 8.4%), and Ute (0.86%, a difference of 9.4%).
| Demographics | Rating | Rank | Disability Age Under 5 |
| Immigrants | Armenia | 100.0 /100 | #1 | Exceptional 0.76% |
| Immigrants | St. Vincent and the Grenadines | 100.0 /100 | #2 | Exceptional 0.79% |
| Vietnamese | 100.0 /100 | #3 | Exceptional 0.81% |
| Immigrants | Uzbekistan | 100.0 /100 | #4 | Exceptional 0.85% |
| Immigrants | Bangladesh | 100.0 /100 | #5 | Exceptional 0.85% |
| Ute | 100.0 /100 | #6 | Exceptional 0.86% |
| Immigrants | Afghanistan | 100.0 /100 | #7 | Exceptional 0.91% |
| Immigrants | Yemen | 100.0 /100 | #8 | Exceptional 0.91% |
| Immigrants | Fiji | 100.0 /100 | #9 | Exceptional 0.92% |
| Marshallese | 100.0 /100 | #10 | Exceptional 0.94% |
| Afghans | 100.0 /100 | #11 | Exceptional 0.94% |
| Immigrants | Grenada | 100.0 /100 | #12 | Exceptional 0.94% |
| Soviet Union | 100.0 /100 | #13 | Exceptional 0.95% |
| Yuman | 100.0 /100 | #14 | Exceptional 0.95% |
| Immigrants | Hong Kong | 100.0 /100 | #15 | Exceptional 0.95% |
Demographics Similar to Scottish by Disability Age Under 5
In terms of disability age under 5, the demographic groups most similar to Scottish are Creek (1.6%, a difference of 0.070%), Blackfeet (1.6%, a difference of 0.10%), Navajo (1.6%, a difference of 0.14%), Seminole (1.6%, a difference of 0.26%), and Cape Verdean (1.7%, a difference of 0.77%).
| Demographics | Rating | Rank | Disability Age Under 5 |
| Shoshone | 0.0 /100 | #300 | Tragic 1.6% |
| German Russians | 0.0 /100 | #301 | Tragic 1.6% |
| Welsh | 0.0 /100 | #302 | Tragic 1.6% |
| Swiss | 0.0 /100 | #303 | Tragic 1.6% |
| Seminole | 0.0 /100 | #304 | Tragic 1.6% |
| Blackfeet | 0.0 /100 | #305 | Tragic 1.6% |
| Creek | 0.0 /100 | #306 | Tragic 1.6% |
| Scottish | 0.0 /100 | #307 | Tragic 1.6% |
| Navajo | 0.0 /100 | #308 | Tragic 1.6% |
| Cape Verdeans | 0.0 /100 | #309 | Tragic 1.7% |
| Whites/Caucasians | 0.0 /100 | #310 | Tragic 1.7% |
| English | 0.0 /100 | #311 | Tragic 1.7% |
| Puerto Ricans | 0.0 /100 | #312 | Tragic 1.7% |
| Celtics | 0.0 /100 | #313 | Tragic 1.7% |
| Norwegians | 0.0 /100 | #314 | Tragic 1.7% |