Scotch-Irish vs Immigrants from Greece Disability Age Under 5
COMPARE
Scotch-Irish
Immigrants from Greece
Disability Age Under 5
Disability Age Under 5 Comparison
Scotch-Irish
Immigrants from Greece
1.7%
DISABILITY AGE UNDER 5
0.0/ 100
METRIC RATING
320th/ 347
METRIC RANK
1.3%
DISABILITY AGE UNDER 5
19.1/ 100
METRIC RATING
211th/ 347
METRIC RANK
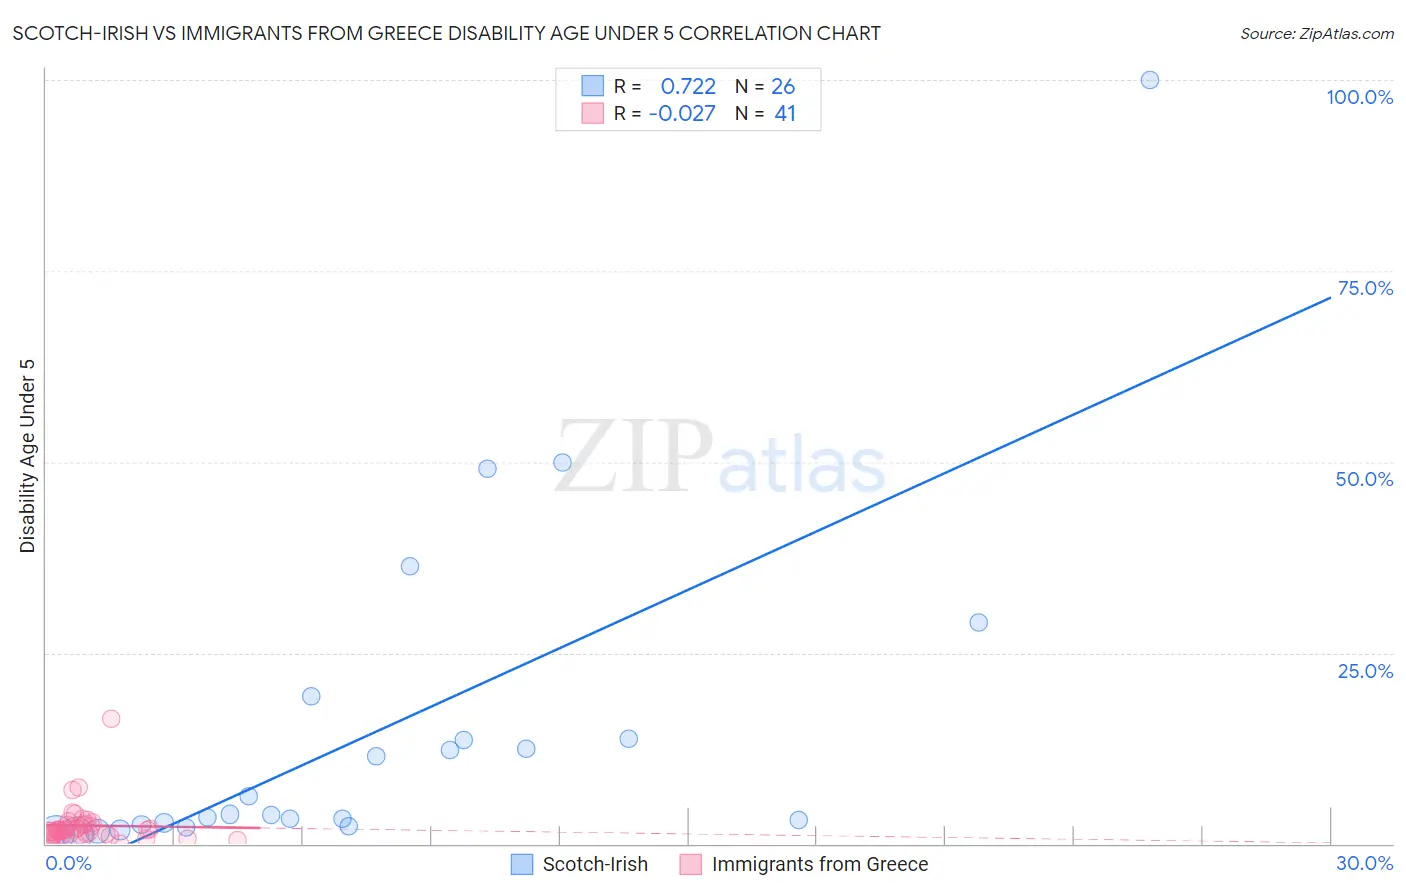
Scotch-Irish vs Immigrants from Greece Disability Age Under 5 Correlation Chart
The statistical analysis conducted on geographies consisting of 253,637,747 people shows a strong positive correlation between the proportion of Scotch-Irish and percentage of population with a disability under the age of 5 in the United States with a correlation coefficient (R) of 0.722 and weighted average of 1.7%. Similarly, the statistical analysis conducted on geographies consisting of 132,613,079 people shows no correlation between the proportion of Immigrants from Greece and percentage of population with a disability under the age of 5 in the United States with a correlation coefficient (R) of -0.027 and weighted average of 1.3%, a difference of 33.5%.
Disability Age Under 5 Correlation Summary
| Measurement | Scotch-Irish | Immigrants from Greece |
| Minimum | 1.3% | 0.058% |
| Maximum | 100.0% | 16.3% |
| Range | 98.7% | 16.2% |
| Mean | 15.0% | 2.4% |
| Median | 3.8% | 1.7% |
| Interquartile 25% (IQ1) | 2.5% | 1.2% |
| Interquartile 75% (IQ3) | 13.7% | 2.6% |
| Interquartile Range (IQR) | 11.1% | 1.4% |
| Standard Deviation (Sample) | 22.4% | 2.7% |
| Standard Deviation (Population) | 22.0% | 2.6% |
Similar Demographics by Disability Age Under 5
Demographics Similar to Scotch-Irish by Disability Age Under 5
In terms of disability age under 5, the demographic groups most similar to Scotch-Irish are Ottawa (1.7%, a difference of 0.060%), Slovak (1.7%, a difference of 0.53%), German (1.7%, a difference of 0.63%), Irish (1.7%, a difference of 0.84%), and French (1.7%, a difference of 1.1%).
| Demographics | Rating | Rank | Disability Age Under 5 |
| Celtics | 0.0 /100 | #313 | Tragic 1.7% |
| Norwegians | 0.0 /100 | #314 | Tragic 1.7% |
| Dutch | 0.0 /100 | #315 | Tragic 1.7% |
| Immigrants | Cabo Verde | 0.0 /100 | #316 | Tragic 1.7% |
| French | 0.0 /100 | #317 | Tragic 1.7% |
| Irish | 0.0 /100 | #318 | Tragic 1.7% |
| Slovaks | 0.0 /100 | #319 | Tragic 1.7% |
| Scotch-Irish | 0.0 /100 | #320 | Tragic 1.7% |
| Ottawa | 0.0 /100 | #321 | Tragic 1.7% |
| Germans | 0.0 /100 | #322 | Tragic 1.7% |
| Chickasaw | 0.0 /100 | #323 | Tragic 1.7% |
| Cherokee | 0.0 /100 | #324 | Tragic 1.8% |
| Immigrants | Portugal | 0.0 /100 | #325 | Tragic 1.8% |
| Sioux | 0.0 /100 | #326 | Tragic 1.8% |
| Osage | 0.0 /100 | #327 | Tragic 1.8% |
Demographics Similar to Immigrants from Greece by Disability Age Under 5
In terms of disability age under 5, the demographic groups most similar to Immigrants from Greece are Pakistani (1.3%, a difference of 0.040%), Chilean (1.3%, a difference of 0.040%), Bulgarian (1.3%, a difference of 0.050%), Immigrants from Sudan (1.3%, a difference of 0.060%), and Mexican (1.3%, a difference of 0.23%).
| Demographics | Rating | Rank | Disability Age Under 5 |
| Immigrants | Europe | 23.6 /100 | #204 | Fair 1.3% |
| Romanians | 22.5 /100 | #205 | Fair 1.3% |
| Immigrants | Poland | 22.4 /100 | #206 | Fair 1.3% |
| Nigerians | 21.2 /100 | #207 | Fair 1.3% |
| Mexicans | 20.8 /100 | #208 | Fair 1.3% |
| Bulgarians | 19.5 /100 | #209 | Poor 1.3% |
| Pakistanis | 19.4 /100 | #210 | Poor 1.3% |
| Immigrants | Greece | 19.1 /100 | #211 | Poor 1.3% |
| Chileans | 18.8 /100 | #212 | Poor 1.3% |
| Immigrants | Sudan | 18.7 /100 | #213 | Poor 1.3% |
| Immigrants | Chile | 17.2 /100 | #214 | Poor 1.3% |
| Syrians | 16.1 /100 | #215 | Poor 1.3% |
| Bangladeshis | 15.5 /100 | #216 | Poor 1.3% |
| Cypriots | 14.9 /100 | #217 | Poor 1.3% |
| Malaysians | 13.2 /100 | #218 | Poor 1.3% |