Scotch-Irish vs Scottish Seniors Poverty Over the Age of 75
COMPARE
Scotch-Irish
Scottish
Seniors Poverty Over the Age of 75
Seniors Poverty Over the Age of 75 Comparison
Scotch-Irish
Scottish
10.8%
SENIORS POVERTY OVER THE AGE OF 75
99.6/ 100
METRIC RATING
36th/ 347
METRIC RANK
10.5%
SENIORS POVERTY OVER THE AGE OF 75
99.9/ 100
METRIC RATING
14th/ 347
METRIC RANK
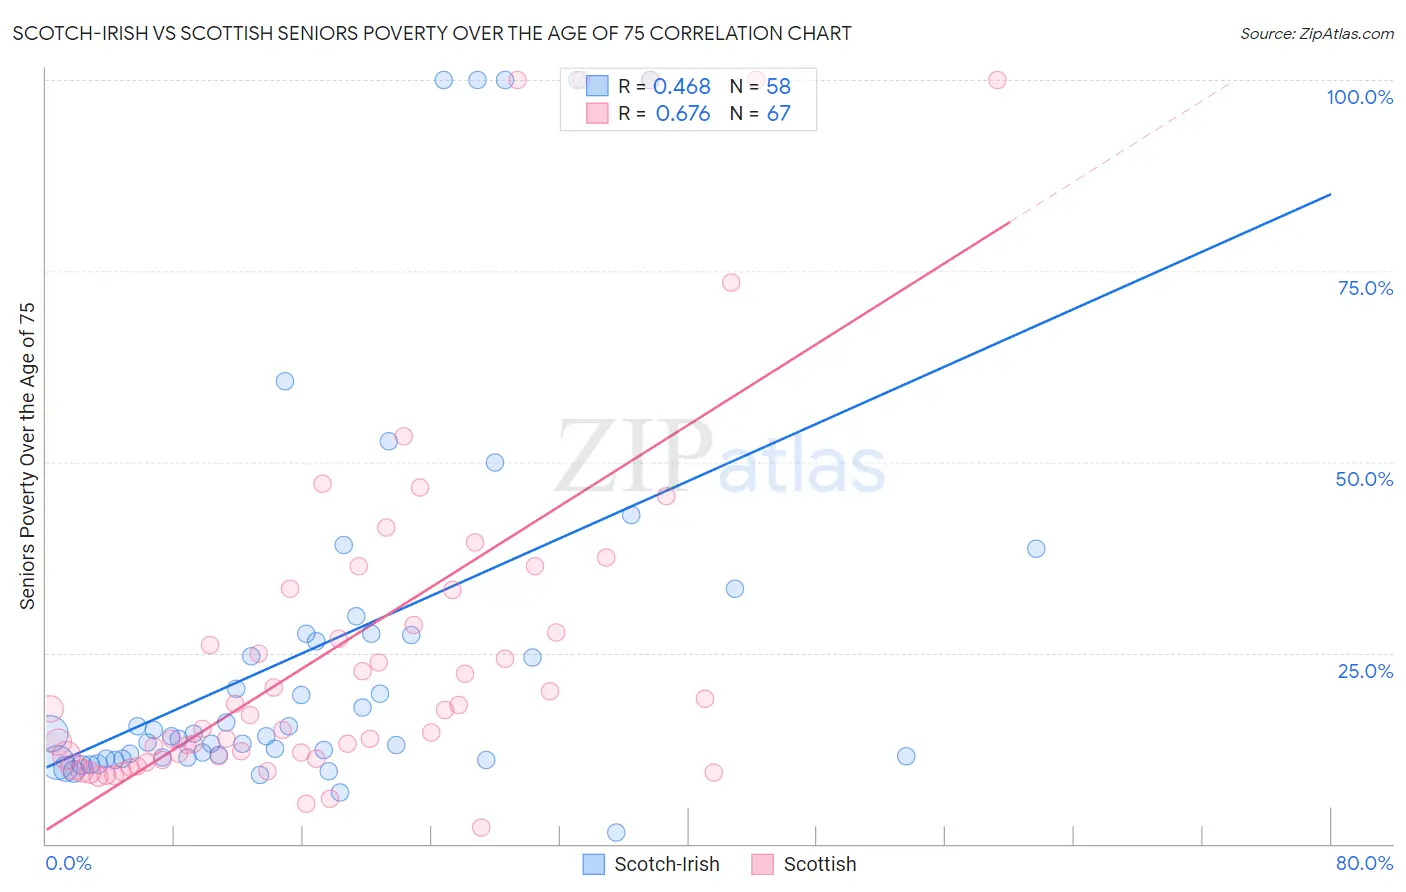
Scotch-Irish vs Scottish Seniors Poverty Over the Age of 75 Correlation Chart
The statistical analysis conducted on geographies consisting of 534,526,562 people shows a moderate positive correlation between the proportion of Scotch-Irish and poverty level among seniors over the age of 75 in the United States with a correlation coefficient (R) of 0.468 and weighted average of 10.8%. Similarly, the statistical analysis conducted on geographies consisting of 550,180,944 people shows a significant positive correlation between the proportion of Scottish and poverty level among seniors over the age of 75 in the United States with a correlation coefficient (R) of 0.676 and weighted average of 10.5%, a difference of 2.8%.
Seniors Poverty Over the Age of 75 Correlation Summary
| Measurement | Scotch-Irish | Scottish |
| Minimum | 1.4% | 2.1% |
| Maximum | 100.0% | 100.0% |
| Range | 98.6% | 97.9% |
| Mean | 25.7% | 26.2% |
| Median | 14.2% | 16.8% |
| Interquartile 25% (IQ1) | 11.2% | 11.1% |
| Interquartile 75% (IQ3) | 27.4% | 33.2% |
| Interquartile Range (IQR) | 16.2% | 22.1% |
| Standard Deviation (Sample) | 25.9% | 24.9% |
| Standard Deviation (Population) | 25.6% | 24.7% |
Similar Demographics by Seniors Poverty Over the Age of 75
Demographics Similar to Scotch-Irish by Seniors Poverty Over the Age of 75
In terms of seniors poverty over the age of 75, the demographic groups most similar to Scotch-Irish are Luxembourger (10.8%, a difference of 0.050%), Latvian (10.8%, a difference of 0.16%), Finnish (10.8%, a difference of 0.30%), Italian (10.8%, a difference of 0.43%), and Puget Sound Salish (10.8%, a difference of 0.49%).
| Demographics | Rating | Rank | Seniors Poverty Over the Age of 75 |
| Assyrians/Chaldeans/Syriacs | 99.8 /100 | #29 | Exceptional 10.7% |
| Swiss | 99.7 /100 | #30 | Exceptional 10.7% |
| Marshallese | 99.7 /100 | #31 | Exceptional 10.7% |
| British | 99.7 /100 | #32 | Exceptional 10.7% |
| Puget Sound Salish | 99.7 /100 | #33 | Exceptional 10.8% |
| Italians | 99.7 /100 | #34 | Exceptional 10.8% |
| Luxembourgers | 99.6 /100 | #35 | Exceptional 10.8% |
| Scotch-Irish | 99.6 /100 | #36 | Exceptional 10.8% |
| Latvians | 99.6 /100 | #37 | Exceptional 10.8% |
| Finns | 99.6 /100 | #38 | Exceptional 10.8% |
| Czechoslovakians | 99.4 /100 | #39 | Exceptional 10.9% |
| Thais | 99.4 /100 | #40 | Exceptional 10.9% |
| Immigrants | Lithuania | 99.2 /100 | #41 | Exceptional 11.0% |
| Austrians | 99.1 /100 | #42 | Exceptional 11.0% |
| Celtics | 99.1 /100 | #43 | Exceptional 11.0% |
Demographics Similar to Scottish by Seniors Poverty Over the Age of 75
In terms of seniors poverty over the age of 75, the demographic groups most similar to Scottish are European (10.5%, a difference of 0.0%), Dutch (10.5%, a difference of 0.12%), Croatian (10.5%, a difference of 0.15%), Tongan (10.5%, a difference of 0.25%), and Slovak (10.5%, a difference of 0.32%).
| Demographics | Rating | Rank | Seniors Poverty Over the Age of 75 |
| Maltese | 100.0 /100 | #7 | Exceptional 10.3% |
| Germans | 99.9 /100 | #8 | Exceptional 10.4% |
| English | 99.9 /100 | #9 | Exceptional 10.4% |
| Scandinavians | 99.9 /100 | #10 | Exceptional 10.4% |
| Immigrants | India | 99.9 /100 | #11 | Exceptional 10.4% |
| Tongans | 99.9 /100 | #12 | Exceptional 10.5% |
| Croatians | 99.9 /100 | #13 | Exceptional 10.5% |
| Scottish | 99.9 /100 | #14 | Exceptional 10.5% |
| Europeans | 99.9 /100 | #15 | Exceptional 10.5% |
| Dutch | 99.9 /100 | #16 | Exceptional 10.5% |
| Slovaks | 99.9 /100 | #17 | Exceptional 10.5% |
| Welsh | 99.9 /100 | #18 | Exceptional 10.5% |
| Immigrants | Scotland | 99.9 /100 | #19 | Exceptional 10.5% |
| Czechs | 99.9 /100 | #20 | Exceptional 10.5% |
| Slovenes | 99.9 /100 | #21 | Exceptional 10.6% |