Scotch-Irish vs Nicaraguan Householder Income Under 25 years
COMPARE
Scotch-Irish
Nicaraguan
Householder Income Under 25 years
Householder Income Under 25 years Comparison
Scotch-Irish
Nicaraguans
$49,039
HOUSEHOLDER INCOME UNDER 25 YEARS
0.0/ 100
METRIC RATING
285th/ 347
METRIC RANK
$53,275
HOUSEHOLDER INCOME UNDER 25 YEARS
93.4/ 100
METRIC RATING
130th/ 347
METRIC RANK
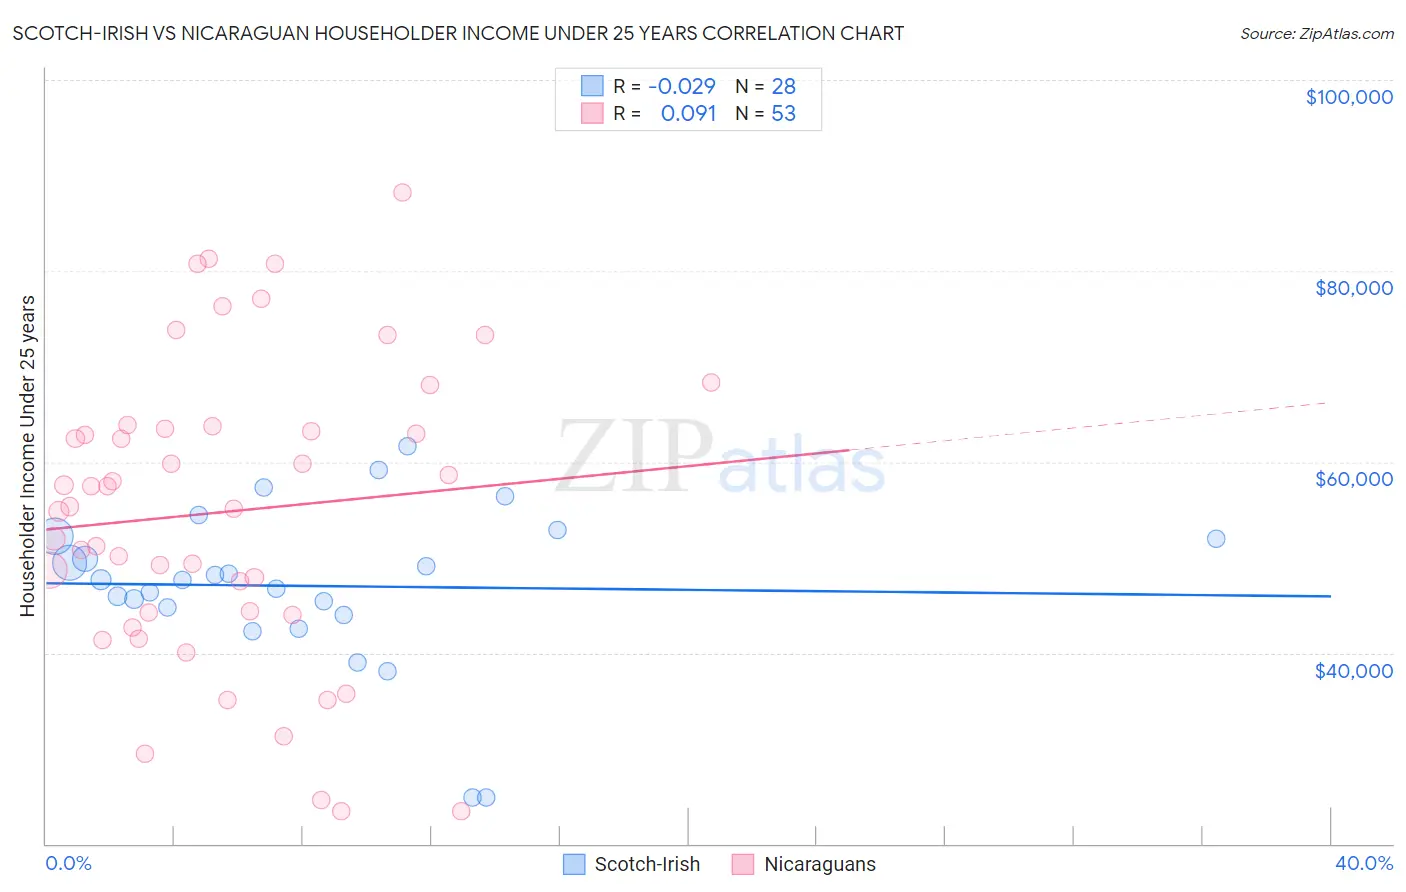
Scotch-Irish vs Nicaraguan Householder Income Under 25 years Correlation Chart
The statistical analysis conducted on geographies consisting of 427,674,236 people shows no correlation between the proportion of Scotch-Irish and household income with householder under the age of 25 in the United States with a correlation coefficient (R) of -0.029 and weighted average of $49,039. Similarly, the statistical analysis conducted on geographies consisting of 251,521,022 people shows a slight positive correlation between the proportion of Nicaraguans and household income with householder under the age of 25 in the United States with a correlation coefficient (R) of 0.091 and weighted average of $53,275, a difference of 8.6%.
Householder Income Under 25 years Correlation Summary
| Measurement | Scotch-Irish | Nicaraguan |
| Minimum | $24,821 | $23,354 |
| Maximum | $61,601 | $88,274 |
| Range | $36,780 | $64,920 |
| Mean | $47,004 | $54,761 |
| Median | $47,645 | $55,328 |
| Interquartile 25% (IQ1) | $44,331 | $44,098 |
| Interquartile 75% (IQ3) | $52,103 | $63,651 |
| Interquartile Range (IQR) | $7,772 | $19,552 |
| Standard Deviation (Sample) | $8,411 | $15,647 |
| Standard Deviation (Population) | $8,259 | $15,499 |
Similar Demographics by Householder Income Under 25 years
Demographics Similar to Scotch-Irish by Householder Income Under 25 years
In terms of householder income under 25 years, the demographic groups most similar to Scotch-Irish are French American Indian ($48,977, a difference of 0.13%), Carpatho Rusyn ($49,113, a difference of 0.15%), Senegalese ($48,953, a difference of 0.18%), Liberian ($48,917, a difference of 0.25%), and Immigrants from Nigeria ($49,174, a difference of 0.28%).
| Demographics | Rating | Rank | Householder Income Under 25 years |
| Nigerians | 0.1 /100 | #278 | Tragic $49,416 |
| Apache | 0.1 /100 | #279 | Tragic $49,395 |
| Hmong | 0.1 /100 | #280 | Tragic $49,364 |
| Immigrants | Nonimmigrants | 0.1 /100 | #281 | Tragic $49,348 |
| Alsatians | 0.1 /100 | #282 | Tragic $49,267 |
| Immigrants | Nigeria | 0.1 /100 | #283 | Tragic $49,174 |
| Carpatho Rusyns | 0.1 /100 | #284 | Tragic $49,113 |
| Scotch-Irish | 0.0 /100 | #285 | Tragic $49,039 |
| French American Indians | 0.0 /100 | #286 | Tragic $48,977 |
| Senegalese | 0.0 /100 | #287 | Tragic $48,953 |
| Liberians | 0.0 /100 | #288 | Tragic $48,917 |
| Hondurans | 0.0 /100 | #289 | Tragic $48,885 |
| Americans | 0.0 /100 | #290 | Tragic $48,860 |
| Immigrants | Burma/Myanmar | 0.0 /100 | #291 | Tragic $48,749 |
| Shoshone | 0.0 /100 | #292 | Tragic $48,720 |
Demographics Similar to Nicaraguans by Householder Income Under 25 years
In terms of householder income under 25 years, the demographic groups most similar to Nicaraguans are Immigrants from Nicaragua ($53,266, a difference of 0.020%), Moroccan ($53,256, a difference of 0.030%), New Zealander ($53,294, a difference of 0.040%), Immigrants from North America ($53,307, a difference of 0.060%), and Immigrants from Bulgaria ($53,305, a difference of 0.060%).
| Demographics | Rating | Rank | Householder Income Under 25 years |
| Immigrants | Iraq | 94.9 /100 | #123 | Exceptional $53,384 |
| Colombians | 94.6 /100 | #124 | Exceptional $53,357 |
| Pakistanis | 94.1 /100 | #125 | Exceptional $53,325 |
| Immigrants | Serbia | 94.1 /100 | #126 | Exceptional $53,321 |
| Immigrants | North America | 93.9 /100 | #127 | Exceptional $53,307 |
| Immigrants | Bulgaria | 93.9 /100 | #128 | Exceptional $53,305 |
| New Zealanders | 93.7 /100 | #129 | Exceptional $53,294 |
| Nicaraguans | 93.4 /100 | #130 | Exceptional $53,275 |
| Immigrants | Nicaragua | 93.3 /100 | #131 | Exceptional $53,266 |
| Moroccans | 93.1 /100 | #132 | Exceptional $53,256 |
| Immigrants | Immigrants | 92.2 /100 | #133 | Exceptional $53,201 |
| Immigrants | Northern Africa | 91.9 /100 | #134 | Exceptional $53,185 |
| Chileans | 91.9 /100 | #135 | Exceptional $53,185 |
| Armenians | 91.8 /100 | #136 | Exceptional $53,179 |
| Immigrants | Barbados | 91.5 /100 | #137 | Exceptional $53,163 |