Taiwanese vs Israeli Disability Age 18 to 34
COMPARE
Taiwanese
Israeli
Disability Age 18 to 34
Disability Age 18 to 34 Comparison
Taiwanese
Israelis
6.0%
DISABILITY AGE 18 TO 34
99.6/ 100
METRIC RATING
64th/ 347
METRIC RANK
6.1%
DISABILITY AGE 18 TO 34
98.3/ 100
METRIC RATING
84th/ 347
METRIC RANK
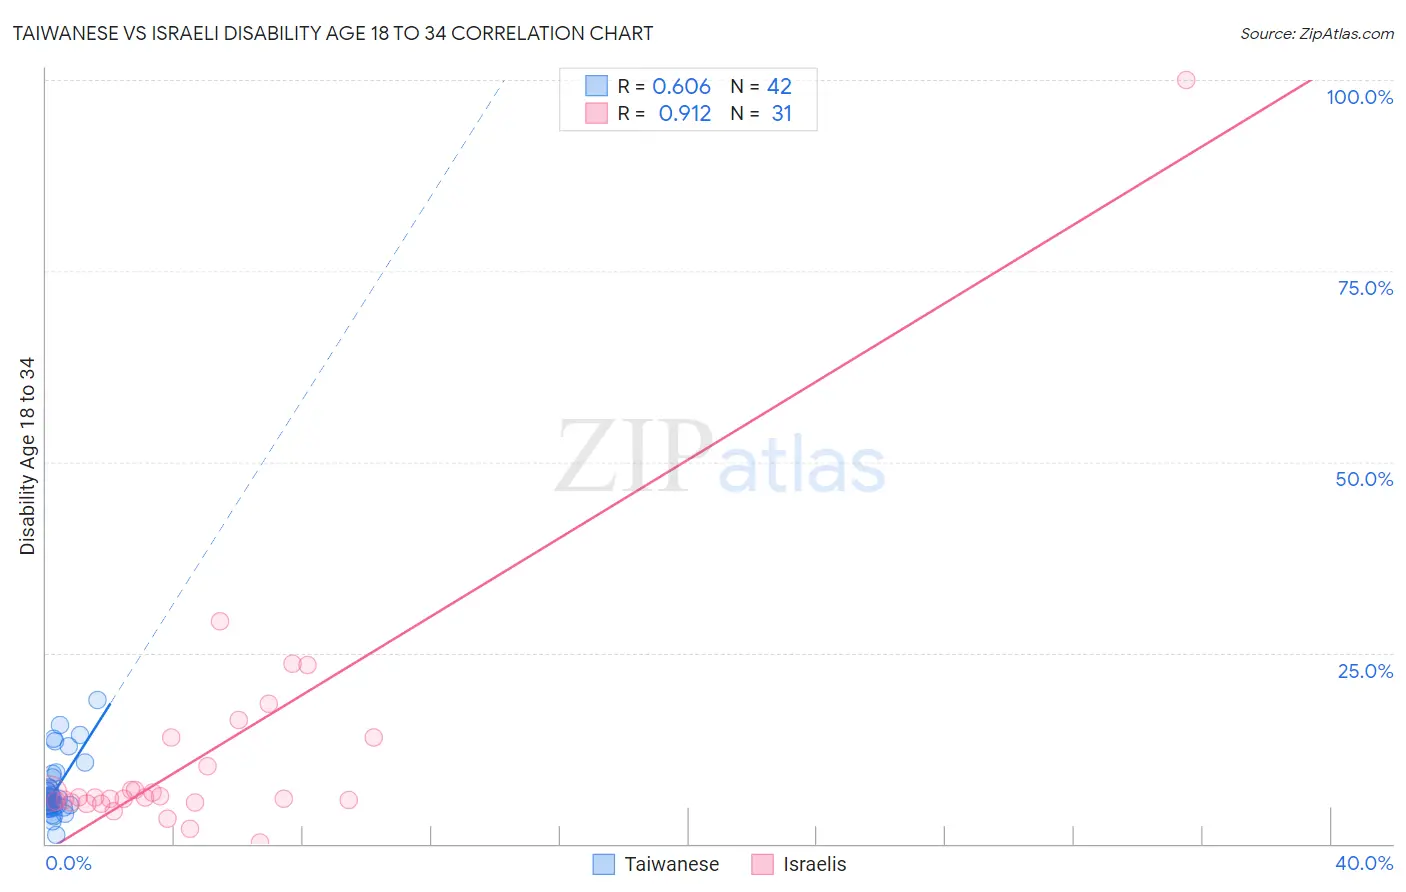
Taiwanese vs Israeli Disability Age 18 to 34 Correlation Chart
The statistical analysis conducted on geographies consisting of 31,720,747 people shows a significant positive correlation between the proportion of Taiwanese and percentage of population with a disability between the ages 18 and 35 in the United States with a correlation coefficient (R) of 0.606 and weighted average of 6.0%. Similarly, the statistical analysis conducted on geographies consisting of 210,930,100 people shows a near-perfect positive correlation between the proportion of Israelis and percentage of population with a disability between the ages 18 and 35 in the United States with a correlation coefficient (R) of 0.912 and weighted average of 6.1%, a difference of 2.7%.
Disability Age 18 to 34 Correlation Summary
| Measurement | Taiwanese | Israeli |
| Minimum | 1.1% | 0.20% |
| Maximum | 18.8% | 100.0% |
| Range | 17.7% | 99.8% |
| Mean | 7.0% | 11.8% |
| Median | 5.6% | 6.0% |
| Interquartile 25% (IQ1) | 4.8% | 5.4% |
| Interquartile 75% (IQ3) | 7.3% | 13.8% |
| Interquartile Range (IQR) | 2.5% | 8.4% |
| Standard Deviation (Sample) | 3.7% | 17.7% |
| Standard Deviation (Population) | 3.7% | 17.4% |
Demographics Similar to Taiwanese and Israelis by Disability Age 18 to 34
In terms of disability age 18 to 34, the demographic groups most similar to Taiwanese are Trinidadian and Tobagonian (6.0%, a difference of 0.14%), Burmese (6.0%, a difference of 0.28%), Immigrants from North Macedonia (6.0%, a difference of 0.32%), Immigrants from Poland (6.0%, a difference of 0.38%), and Immigrants from West Indies (6.0%, a difference of 0.63%). Similarly, the demographic groups most similar to Israelis are Barbadian (6.1%, a difference of 0.030%), Immigrants from Northern Africa (6.1%, a difference of 0.10%), Immigrants from Australia (6.1%, a difference of 0.28%), Immigrants from Chile (6.1%, a difference of 0.32%), and Afghan (6.1%, a difference of 0.51%).
| Demographics | Rating | Rank | Disability Age 18 to 34 |
| Taiwanese | 99.6 /100 | #64 | Exceptional 6.0% |
| Trinidadians and Tobagonians | 99.5 /100 | #65 | Exceptional 6.0% |
| Burmese | 99.5 /100 | #66 | Exceptional 6.0% |
| Immigrants | North Macedonia | 99.5 /100 | #67 | Exceptional 6.0% |
| Immigrants | Poland | 99.5 /100 | #68 | Exceptional 6.0% |
| Immigrants | West Indies | 99.4 /100 | #69 | Exceptional 6.0% |
| Immigrants | Greece | 99.4 /100 | #70 | Exceptional 6.0% |
| Immigrants | Japan | 99.3 /100 | #71 | Exceptional 6.0% |
| Immigrants | Lebanon | 99.2 /100 | #72 | Exceptional 6.0% |
| Cypriots | 99.2 /100 | #73 | Exceptional 6.0% |
| Haitians | 99.2 /100 | #74 | Exceptional 6.0% |
| Immigrants | Turkey | 99.1 /100 | #75 | Exceptional 6.1% |
| Immigrants | Western Asia | 98.9 /100 | #76 | Exceptional 6.1% |
| Immigrants | Russia | 98.9 /100 | #77 | Exceptional 6.1% |
| Assyrians/Chaldeans/Syriacs | 98.9 /100 | #78 | Exceptional 6.1% |
| Afghans | 98.7 /100 | #79 | Exceptional 6.1% |
| Immigrants | Chile | 98.5 /100 | #80 | Exceptional 6.1% |
| Immigrants | Australia | 98.5 /100 | #81 | Exceptional 6.1% |
| Immigrants | Northern Africa | 98.4 /100 | #82 | Exceptional 6.1% |
| Barbadians | 98.3 /100 | #83 | Exceptional 6.1% |
| Israelis | 98.3 /100 | #84 | Exceptional 6.1% |