Basque vs Israeli Disability Age 18 to 34
COMPARE
Basque
Israeli
Disability Age 18 to 34
Disability Age 18 to 34 Comparison
Basques
Israelis
7.4%
DISABILITY AGE 18 TO 34
0.1/ 100
METRIC RATING
269th/ 347
METRIC RANK
6.1%
DISABILITY AGE 18 TO 34
98.3/ 100
METRIC RATING
84th/ 347
METRIC RANK
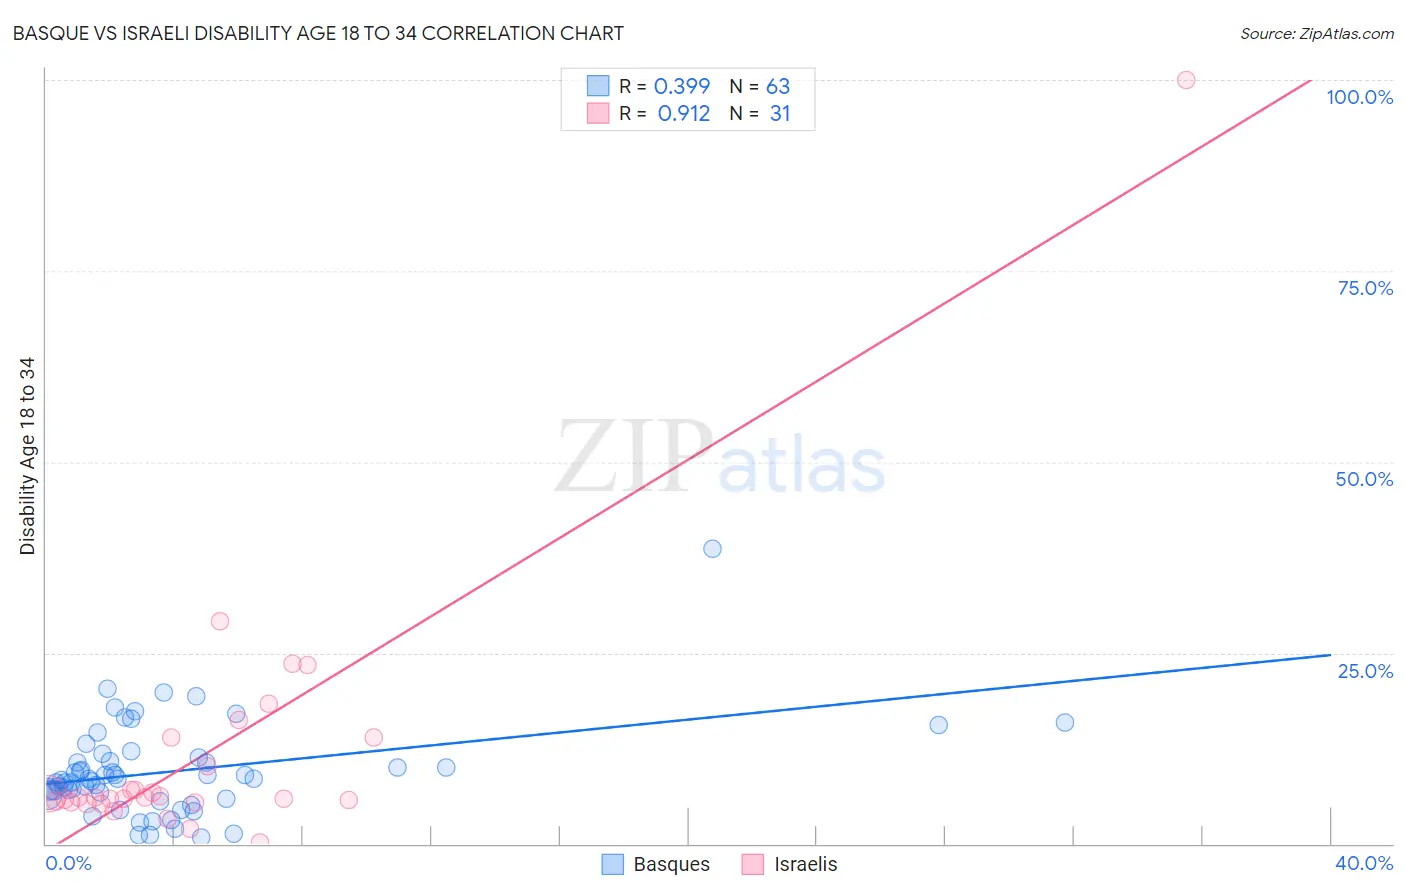
Basque vs Israeli Disability Age 18 to 34 Correlation Chart
The statistical analysis conducted on geographies consisting of 165,605,006 people shows a mild positive correlation between the proportion of Basques and percentage of population with a disability between the ages 18 and 35 in the United States with a correlation coefficient (R) of 0.399 and weighted average of 7.4%. Similarly, the statistical analysis conducted on geographies consisting of 210,930,100 people shows a near-perfect positive correlation between the proportion of Israelis and percentage of population with a disability between the ages 18 and 35 in the United States with a correlation coefficient (R) of 0.912 and weighted average of 6.1%, a difference of 20.1%.
Disability Age 18 to 34 Correlation Summary
| Measurement | Basque | Israeli |
| Minimum | 0.88% | 0.20% |
| Maximum | 38.6% | 100.0% |
| Range | 37.7% | 99.8% |
| Mean | 9.5% | 11.8% |
| Median | 8.5% | 6.0% |
| Interquartile 25% (IQ1) | 6.5% | 5.4% |
| Interquartile 75% (IQ3) | 11.2% | 13.8% |
| Interquartile Range (IQR) | 4.8% | 8.4% |
| Standard Deviation (Sample) | 6.1% | 17.7% |
| Standard Deviation (Population) | 6.0% | 17.4% |
Similar Demographics by Disability Age 18 to 34
Demographics Similar to Basques by Disability Age 18 to 34
In terms of disability age 18 to 34, the demographic groups most similar to Basques are Portuguese (7.4%, a difference of 0.040%), Belgian (7.4%, a difference of 0.090%), Bangladeshi (7.4%, a difference of 0.11%), Swiss (7.4%, a difference of 0.14%), and German Russian (7.4%, a difference of 0.18%).
| Demographics | Rating | Rank | Disability Age 18 to 34 |
| Canadians | 0.2 /100 | #262 | Tragic 7.3% |
| British | 0.2 /100 | #263 | Tragic 7.3% |
| Bermudans | 0.1 /100 | #264 | Tragic 7.3% |
| Slovenes | 0.1 /100 | #265 | Tragic 7.3% |
| German Russians | 0.1 /100 | #266 | Tragic 7.4% |
| Bangladeshis | 0.1 /100 | #267 | Tragic 7.4% |
| Portuguese | 0.1 /100 | #268 | Tragic 7.4% |
| Basques | 0.1 /100 | #269 | Tragic 7.4% |
| Belgians | 0.1 /100 | #270 | Tragic 7.4% |
| Swiss | 0.1 /100 | #271 | Tragic 7.4% |
| Tsimshian | 0.1 /100 | #272 | Tragic 7.4% |
| Slavs | 0.1 /100 | #273 | Tragic 7.4% |
| Africans | 0.1 /100 | #274 | Tragic 7.4% |
| Immigrants | Somalia | 0.1 /100 | #275 | Tragic 7.4% |
| Europeans | 0.1 /100 | #276 | Tragic 7.4% |
Demographics Similar to Israelis by Disability Age 18 to 34
In terms of disability age 18 to 34, the demographic groups most similar to Israelis are Barbadian (6.1%, a difference of 0.030%), Immigrants from Ireland (6.1%, a difference of 0.080%), Immigrants from Northern Africa (6.1%, a difference of 0.10%), Immigrants from Australia (6.1%, a difference of 0.28%), and Immigrants from Kuwait (6.2%, a difference of 0.30%).
| Demographics | Rating | Rank | Disability Age 18 to 34 |
| Immigrants | Russia | 98.9 /100 | #77 | Exceptional 6.1% |
| Assyrians/Chaldeans/Syriacs | 98.9 /100 | #78 | Exceptional 6.1% |
| Afghans | 98.7 /100 | #79 | Exceptional 6.1% |
| Immigrants | Chile | 98.5 /100 | #80 | Exceptional 6.1% |
| Immigrants | Australia | 98.5 /100 | #81 | Exceptional 6.1% |
| Immigrants | Northern Africa | 98.4 /100 | #82 | Exceptional 6.1% |
| Barbadians | 98.3 /100 | #83 | Exceptional 6.1% |
| Israelis | 98.3 /100 | #84 | Exceptional 6.1% |
| Immigrants | Ireland | 98.2 /100 | #85 | Exceptional 6.1% |
| Immigrants | Kuwait | 98.0 /100 | #86 | Exceptional 6.2% |
| Immigrants | Eastern Europe | 97.9 /100 | #87 | Exceptional 6.2% |
| Cambodians | 97.8 /100 | #88 | Exceptional 6.2% |
| Turks | 97.8 /100 | #89 | Exceptional 6.2% |
| Immigrants | Vietnam | 97.7 /100 | #90 | Exceptional 6.2% |
| Immigrants | Philippines | 97.6 /100 | #91 | Exceptional 6.2% |