Scotch-Irish vs Choctaw Unemployment
COMPARE
Scotch-Irish
Choctaw
Unemployment
Unemployment Comparison
Scotch-Irish
Choctaw
4.8%
UNEMPLOYMENT
99.8/ 100
METRIC RATING
35th/ 347
METRIC RANK
5.4%
UNEMPLOYMENT
12.7/ 100
METRIC RATING
218th/ 347
METRIC RANK
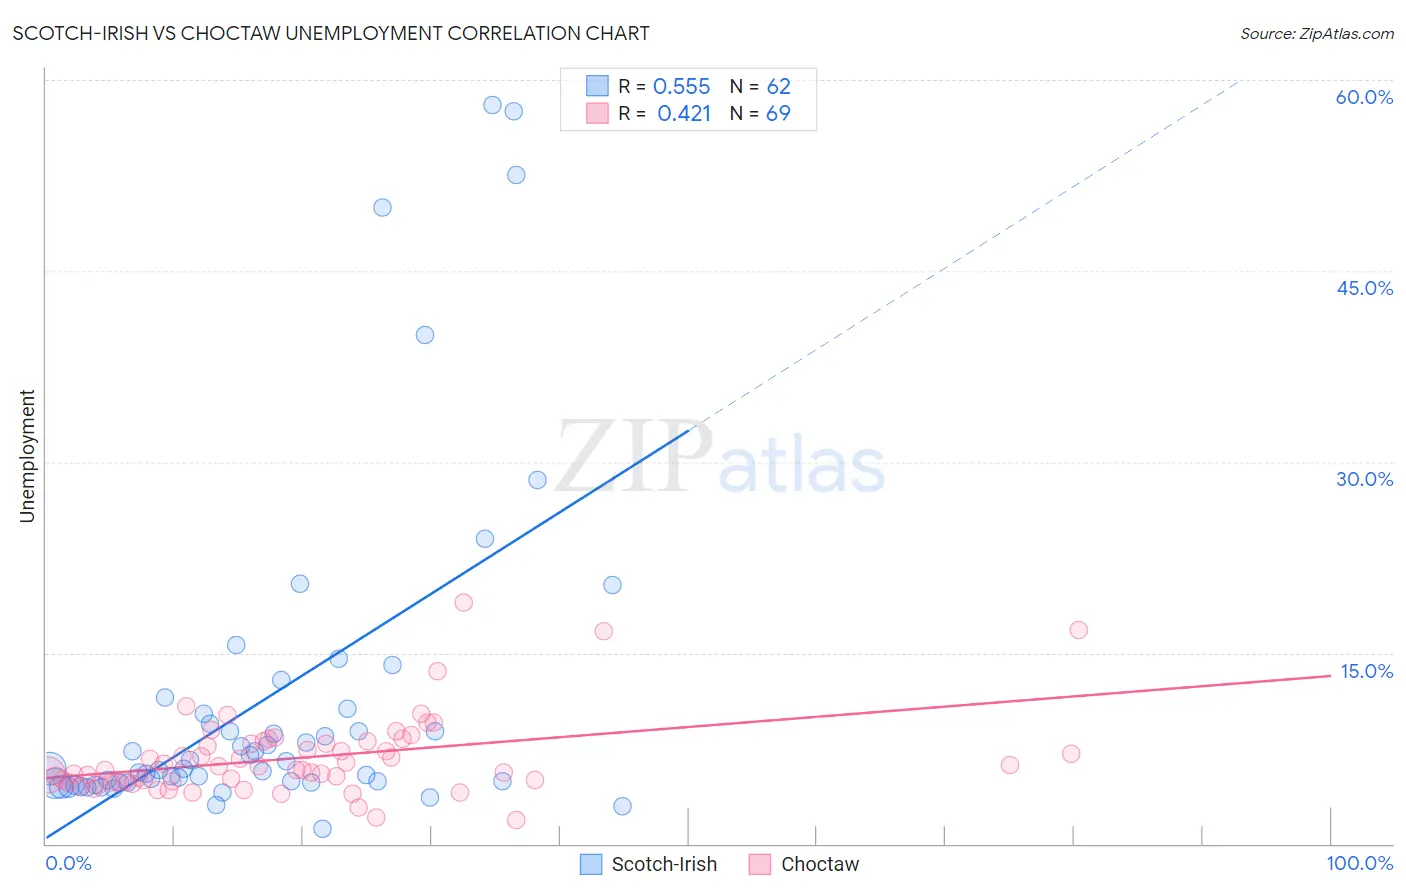
Scotch-Irish vs Choctaw Unemployment Correlation Chart
The statistical analysis conducted on geographies consisting of 545,559,279 people shows a substantial positive correlation between the proportion of Scotch-Irish and unemployment in the United States with a correlation coefficient (R) of 0.555 and weighted average of 4.8%. Similarly, the statistical analysis conducted on geographies consisting of 269,338,927 people shows a moderate positive correlation between the proportion of Choctaw and unemployment in the United States with a correlation coefficient (R) of 0.421 and weighted average of 5.4%, a difference of 13.6%.
Unemployment Correlation Summary
| Measurement | Scotch-Irish | Choctaw |
| Minimum | 1.2% | 1.9% |
| Maximum | 58.0% | 19.0% |
| Range | 56.8% | 17.1% |
| Mean | 11.3% | 6.7% |
| Median | 5.9% | 5.8% |
| Interquartile 25% (IQ1) | 4.8% | 4.9% |
| Interquartile 75% (IQ3) | 10.2% | 8.0% |
| Interquartile Range (IQR) | 5.4% | 3.1% |
| Standard Deviation (Sample) | 13.2% | 3.1% |
| Standard Deviation (Population) | 13.1% | 3.1% |
Similar Demographics by Unemployment
Demographics Similar to Scotch-Irish by Unemployment
In terms of unemployment, the demographic groups most similar to Scotch-Irish are Immigrants from Bolivia (4.8%, a difference of 0.070%), Sudanese (4.8%, a difference of 0.11%), Zimbabwean (4.8%, a difference of 0.12%), Croatian (4.8%, a difference of 0.22%), and Tongan (4.8%, a difference of 0.22%).
| Demographics | Rating | Rank | Unemployment |
| Cubans | 99.8 /100 | #28 | Exceptional 4.7% |
| Poles | 99.8 /100 | #29 | Exceptional 4.7% |
| Irish | 99.8 /100 | #30 | Exceptional 4.8% |
| Croatians | 99.8 /100 | #31 | Exceptional 4.8% |
| Zimbabweans | 99.8 /100 | #32 | Exceptional 4.8% |
| Sudanese | 99.8 /100 | #33 | Exceptional 4.8% |
| Immigrants | Bolivia | 99.8 /100 | #34 | Exceptional 4.8% |
| Scotch-Irish | 99.8 /100 | #35 | Exceptional 4.8% |
| Tongans | 99.7 /100 | #36 | Exceptional 4.8% |
| Czechoslovakians | 99.7 /100 | #37 | Exceptional 4.8% |
| Bolivians | 99.7 /100 | #38 | Exceptional 4.8% |
| Lithuanians | 99.7 /100 | #39 | Exceptional 4.8% |
| Northern Europeans | 99.7 /100 | #40 | Exceptional 4.8% |
| Immigrants | Bosnia and Herzegovina | 99.7 /100 | #41 | Exceptional 4.8% |
| Filipinos | 99.5 /100 | #42 | Exceptional 4.8% |
Demographics Similar to Choctaw by Unemployment
In terms of unemployment, the demographic groups most similar to Choctaw are Immigrants from South America (5.4%, a difference of 0.10%), Immigrants from Albania (5.4%, a difference of 0.10%), Bangladeshi (5.4%, a difference of 0.22%), Delaware (5.4%, a difference of 0.26%), and Soviet Union (5.4%, a difference of 0.30%).
| Demographics | Rating | Rank | Unemployment |
| Iraqis | 18.1 /100 | #211 | Poor 5.4% |
| Ugandans | 18.0 /100 | #212 | Poor 5.4% |
| Immigrants | Middle Africa | 15.3 /100 | #213 | Poor 5.4% |
| Immigrants | Costa Rica | 15.2 /100 | #214 | Poor 5.4% |
| Delaware | 14.7 /100 | #215 | Poor 5.4% |
| Immigrants | South America | 13.5 /100 | #216 | Poor 5.4% |
| Immigrants | Albania | 13.5 /100 | #217 | Poor 5.4% |
| Choctaw | 12.7 /100 | #218 | Poor 5.4% |
| Bangladeshis | 11.2 /100 | #219 | Poor 5.4% |
| Soviet Union | 10.6 /100 | #220 | Poor 5.4% |
| Immigrants | Philippines | 10.4 /100 | #221 | Poor 5.4% |
| Iroquois | 10.3 /100 | #222 | Poor 5.4% |
| Seminole | 9.2 /100 | #223 | Tragic 5.4% |
| Israelis | 8.8 /100 | #224 | Tragic 5.4% |
| South American Indians | 7.8 /100 | #225 | Tragic 5.5% |