Scotch-Irish vs Argentinean Cognitive Disability
COMPARE
Scotch-Irish
Argentinean
Cognitive Disability
Cognitive Disability Comparison
Scotch-Irish
Argentineans
17.1%
COGNITIVE DISABILITY
85.9/ 100
METRIC RATING
147th/ 347
METRIC RANK
16.6%
COGNITIVE DISABILITY
99.6/ 100
METRIC RATING
63rd/ 347
METRIC RANK
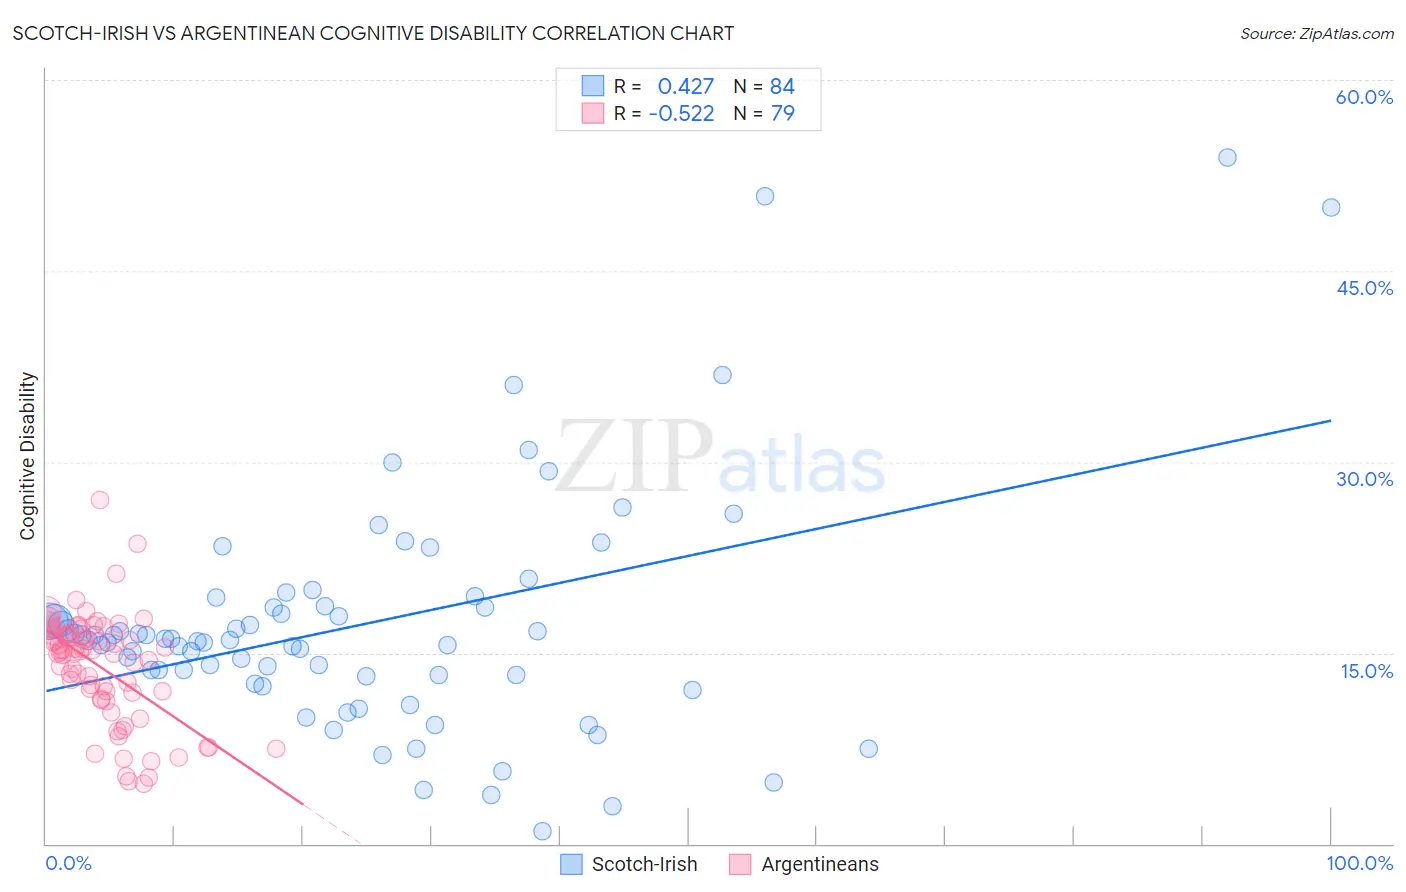
Scotch-Irish vs Argentinean Cognitive Disability Correlation Chart
The statistical analysis conducted on geographies consisting of 548,652,939 people shows a moderate positive correlation between the proportion of Scotch-Irish and percentage of population with cognitive disability in the United States with a correlation coefficient (R) of 0.427 and weighted average of 17.1%. Similarly, the statistical analysis conducted on geographies consisting of 297,134,526 people shows a substantial negative correlation between the proportion of Argentineans and percentage of population with cognitive disability in the United States with a correlation coefficient (R) of -0.522 and weighted average of 16.6%, a difference of 2.8%.
Cognitive Disability Correlation Summary
| Measurement | Scotch-Irish | Argentinean |
| Minimum | 0.99% | 4.8% |
| Maximum | 53.9% | 27.0% |
| Range | 52.9% | 22.2% |
| Mean | 17.2% | 13.9% |
| Median | 16.0% | 15.1% |
| Interquartile 25% (IQ1) | 13.2% | 11.3% |
| Interquartile 75% (IQ3) | 18.6% | 16.5% |
| Interquartile Range (IQR) | 5.4% | 5.1% |
| Standard Deviation (Sample) | 9.4% | 4.3% |
| Standard Deviation (Population) | 9.3% | 4.2% |
Similar Demographics by Cognitive Disability
Demographics Similar to Scotch-Irish by Cognitive Disability
In terms of cognitive disability, the demographic groups most similar to Scotch-Irish are French Canadian (17.1%, a difference of 0.010%), Cypriot (17.1%, a difference of 0.010%), Basque (17.1%, a difference of 0.030%), Costa Rican (17.0%, a difference of 0.13%), and Syrian (17.1%, a difference of 0.16%).
| Demographics | Rating | Rank | Cognitive Disability |
| Chileans | 89.9 /100 | #140 | Excellent 17.0% |
| Aleuts | 89.9 /100 | #141 | Excellent 17.0% |
| Carpatho Rusyns | 89.6 /100 | #142 | Excellent 17.0% |
| British | 89.3 /100 | #143 | Excellent 17.0% |
| Immigrants | Brazil | 89.3 /100 | #144 | Excellent 17.0% |
| Immigrants | South Eastern Asia | 88.7 /100 | #145 | Excellent 17.0% |
| Costa Ricans | 88.0 /100 | #146 | Excellent 17.0% |
| Scotch-Irish | 85.9 /100 | #147 | Excellent 17.1% |
| French Canadians | 85.7 /100 | #148 | Excellent 17.1% |
| Cypriots | 85.7 /100 | #149 | Excellent 17.1% |
| Basques | 85.5 /100 | #150 | Excellent 17.1% |
| Syrians | 83.0 /100 | #151 | Excellent 17.1% |
| Immigrants | Indonesia | 82.7 /100 | #152 | Excellent 17.1% |
| Immigrants | Kazakhstan | 80.5 /100 | #153 | Excellent 17.1% |
| Immigrants | Malaysia | 79.3 /100 | #154 | Good 17.1% |
Demographics Similar to Argentineans by Cognitive Disability
In terms of cognitive disability, the demographic groups most similar to Argentineans are Czechoslovakian (16.6%, a difference of 0.020%), Immigrants from England (16.6%, a difference of 0.050%), Venezuelan (16.6%, a difference of 0.060%), Colombian (16.6%, a difference of 0.070%), and Romanian (16.6%, a difference of 0.12%).
| Demographics | Rating | Rank | Cognitive Disability |
| Austrians | 99.7 /100 | #56 | Exceptional 16.6% |
| Bhutanese | 99.7 /100 | #57 | Exceptional 16.6% |
| Pennsylvania Germans | 99.7 /100 | #58 | Exceptional 16.6% |
| Immigrants | Peru | 99.7 /100 | #59 | Exceptional 16.6% |
| Romanians | 99.7 /100 | #60 | Exceptional 16.6% |
| Immigrants | England | 99.6 /100 | #61 | Exceptional 16.6% |
| Czechoslovakians | 99.6 /100 | #62 | Exceptional 16.6% |
| Argentineans | 99.6 /100 | #63 | Exceptional 16.6% |
| Venezuelans | 99.6 /100 | #64 | Exceptional 16.6% |
| Colombians | 99.6 /100 | #65 | Exceptional 16.6% |
| Immigrants | Ukraine | 99.5 /100 | #66 | Exceptional 16.6% |
| Latvians | 99.5 /100 | #67 | Exceptional 16.6% |
| Ukrainians | 99.4 /100 | #68 | Exceptional 16.6% |
| Immigrants | Uzbekistan | 99.4 /100 | #69 | Exceptional 16.7% |
| Immigrants | Sweden | 99.4 /100 | #70 | Exceptional 16.7% |