Scotch-Irish vs Immigrants from Iran Cognitive Disability
COMPARE
Scotch-Irish
Immigrants from Iran
Cognitive Disability
Cognitive Disability Comparison
Scotch-Irish
Immigrants from Iran
17.1%
COGNITIVE DISABILITY
85.9/ 100
METRIC RATING
147th/ 347
METRIC RANK
16.5%
COGNITIVE DISABILITY
99.8/ 100
METRIC RATING
54th/ 347
METRIC RANK
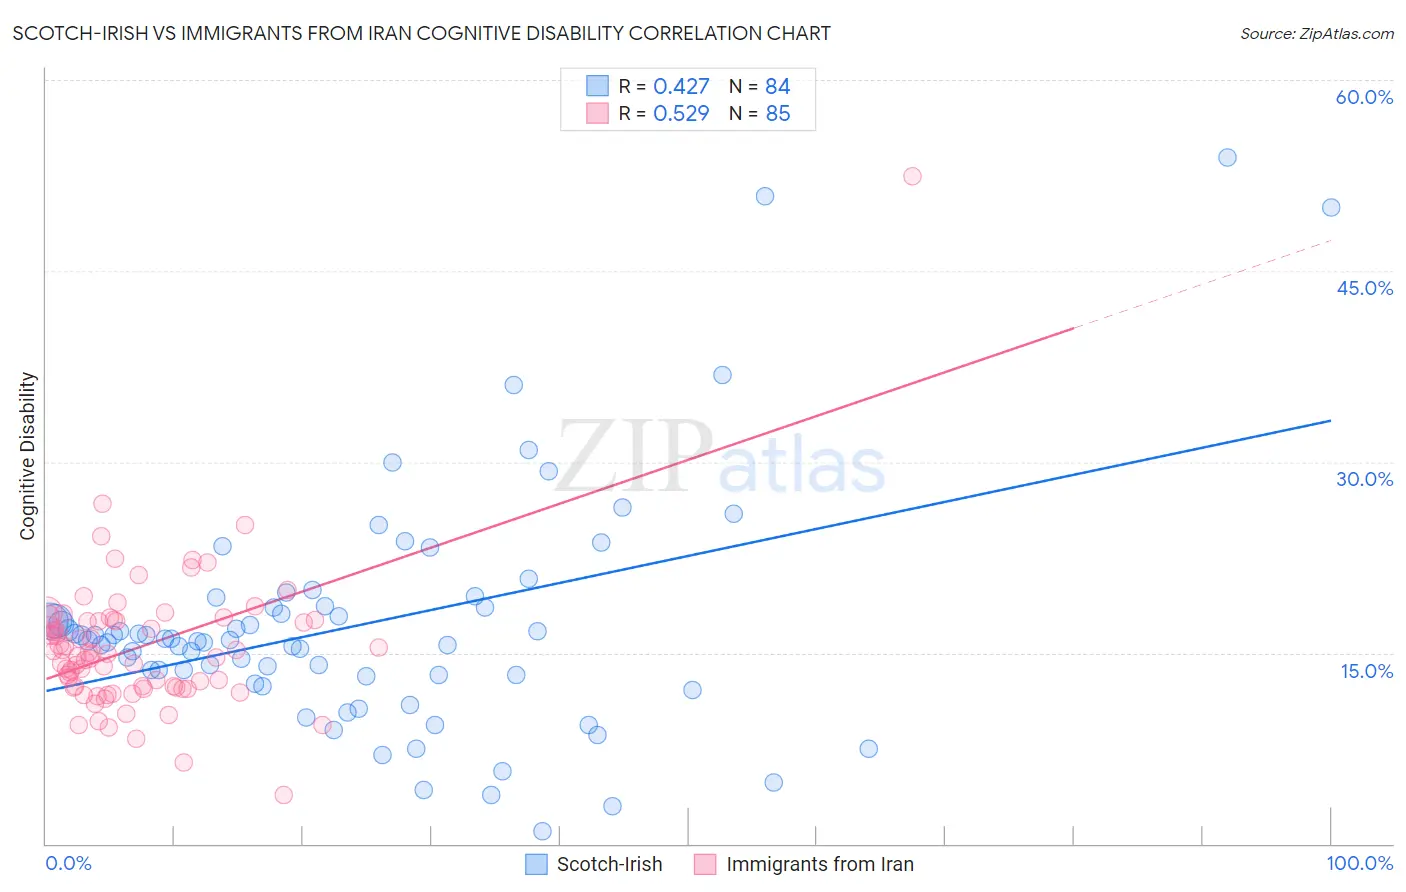
Scotch-Irish vs Immigrants from Iran Cognitive Disability Correlation Chart
The statistical analysis conducted on geographies consisting of 548,652,939 people shows a moderate positive correlation between the proportion of Scotch-Irish and percentage of population with cognitive disability in the United States with a correlation coefficient (R) of 0.427 and weighted average of 17.1%. Similarly, the statistical analysis conducted on geographies consisting of 279,837,445 people shows a substantial positive correlation between the proportion of Immigrants from Iran and percentage of population with cognitive disability in the United States with a correlation coefficient (R) of 0.529 and weighted average of 16.5%, a difference of 3.2%.
Cognitive Disability Correlation Summary
| Measurement | Scotch-Irish | Immigrants from Iran |
| Minimum | 0.99% | 3.9% |
| Maximum | 53.9% | 52.5% |
| Range | 52.9% | 48.6% |
| Mean | 17.2% | 15.5% |
| Median | 16.0% | 14.9% |
| Interquartile 25% (IQ1) | 13.2% | 12.3% |
| Interquartile 75% (IQ3) | 18.6% | 17.5% |
| Interquartile Range (IQR) | 5.4% | 5.3% |
| Standard Deviation (Sample) | 9.4% | 5.7% |
| Standard Deviation (Population) | 9.3% | 5.7% |
Similar Demographics by Cognitive Disability
Demographics Similar to Scotch-Irish by Cognitive Disability
In terms of cognitive disability, the demographic groups most similar to Scotch-Irish are French Canadian (17.1%, a difference of 0.010%), Cypriot (17.1%, a difference of 0.010%), Basque (17.1%, a difference of 0.030%), Costa Rican (17.0%, a difference of 0.13%), and Syrian (17.1%, a difference of 0.16%).
| Demographics | Rating | Rank | Cognitive Disability |
| Chileans | 89.9 /100 | #140 | Excellent 17.0% |
| Aleuts | 89.9 /100 | #141 | Excellent 17.0% |
| Carpatho Rusyns | 89.6 /100 | #142 | Excellent 17.0% |
| British | 89.3 /100 | #143 | Excellent 17.0% |
| Immigrants | Brazil | 89.3 /100 | #144 | Excellent 17.0% |
| Immigrants | South Eastern Asia | 88.7 /100 | #145 | Excellent 17.0% |
| Costa Ricans | 88.0 /100 | #146 | Excellent 17.0% |
| Scotch-Irish | 85.9 /100 | #147 | Excellent 17.1% |
| French Canadians | 85.7 /100 | #148 | Excellent 17.1% |
| Cypriots | 85.7 /100 | #149 | Excellent 17.1% |
| Basques | 85.5 /100 | #150 | Excellent 17.1% |
| Syrians | 83.0 /100 | #151 | Excellent 17.1% |
| Immigrants | Indonesia | 82.7 /100 | #152 | Excellent 17.1% |
| Immigrants | Kazakhstan | 80.5 /100 | #153 | Excellent 17.1% |
| Immigrants | Malaysia | 79.3 /100 | #154 | Good 17.1% |
Demographics Similar to Immigrants from Iran by Cognitive Disability
In terms of cognitive disability, the demographic groups most similar to Immigrants from Iran are Swedish (16.5%, a difference of 0.040%), Immigrants from Venezuela (16.5%, a difference of 0.090%), Soviet Union (16.5%, a difference of 0.10%), Immigrants from Korea (16.5%, a difference of 0.14%), and Austrian (16.6%, a difference of 0.18%).
| Demographics | Rating | Rank | Cognitive Disability |
| Immigrants | Italy | 99.8 /100 | #47 | Exceptional 16.5% |
| Immigrants | North America | 99.8 /100 | #48 | Exceptional 16.5% |
| Iranians | 99.8 /100 | #49 | Exceptional 16.5% |
| Norwegians | 99.8 /100 | #50 | Exceptional 16.5% |
| Immigrants | Korea | 99.8 /100 | #51 | Exceptional 16.5% |
| Soviet Union | 99.8 /100 | #52 | Exceptional 16.5% |
| Swedes | 99.8 /100 | #53 | Exceptional 16.5% |
| Immigrants | Iran | 99.8 /100 | #54 | Exceptional 16.5% |
| Immigrants | Venezuela | 99.7 /100 | #55 | Exceptional 16.5% |
| Austrians | 99.7 /100 | #56 | Exceptional 16.6% |
| Bhutanese | 99.7 /100 | #57 | Exceptional 16.6% |
| Pennsylvania Germans | 99.7 /100 | #58 | Exceptional 16.6% |
| Immigrants | Peru | 99.7 /100 | #59 | Exceptional 16.6% |
| Romanians | 99.7 /100 | #60 | Exceptional 16.6% |
| Immigrants | England | 99.6 /100 | #61 | Exceptional 16.6% |