French vs Chilean Cognitive Disability
COMPARE
French
Chilean
Cognitive Disability
Cognitive Disability Comparison
French
Chileans
17.0%
COGNITIVE DISABILITY
90.0/ 100
METRIC RATING
139th/ 347
METRIC RANK
17.0%
COGNITIVE DISABILITY
89.9/ 100
METRIC RATING
140th/ 347
METRIC RANK
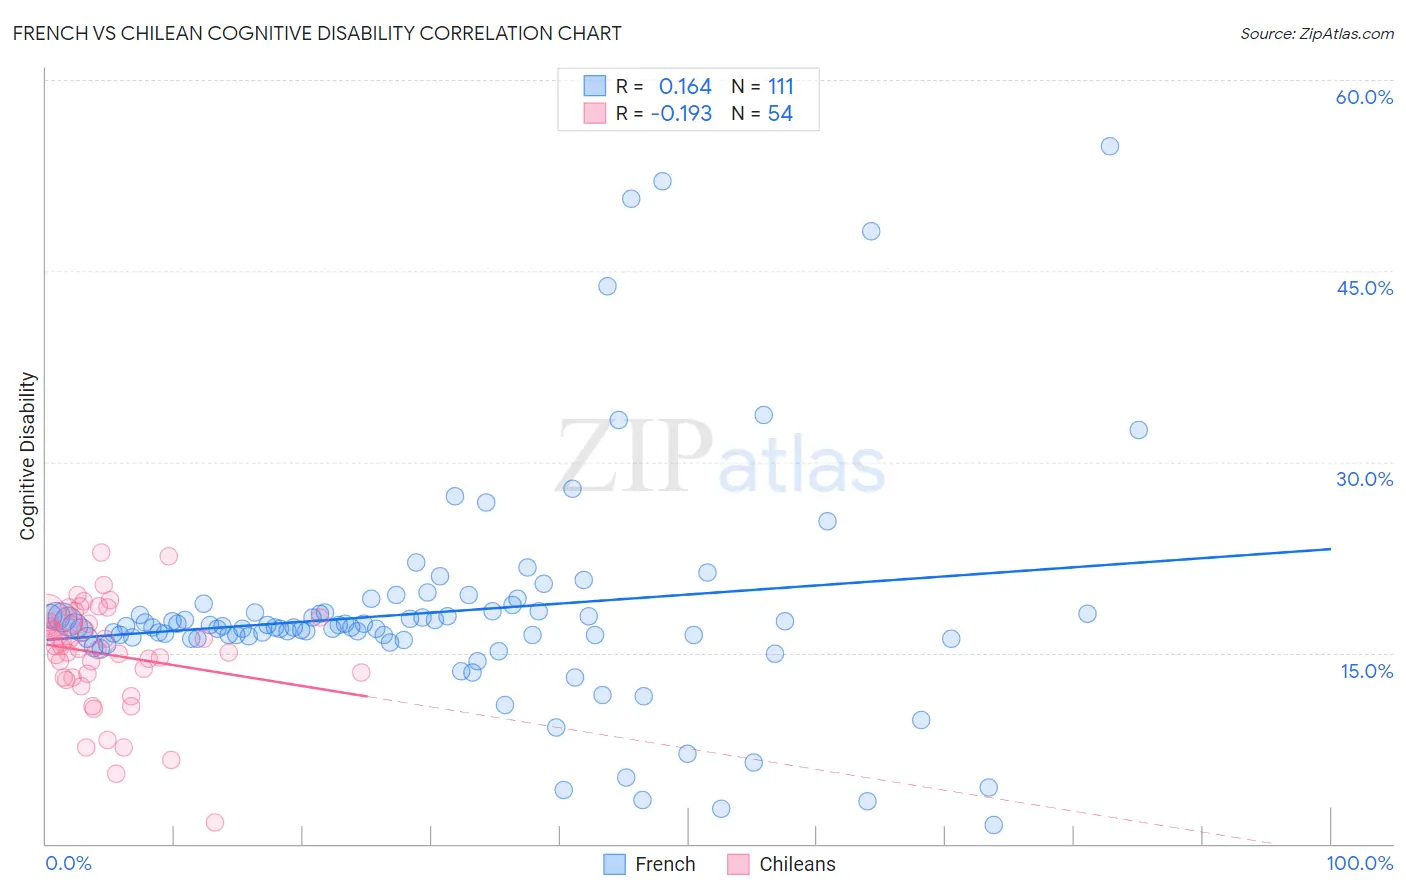
French vs Chilean Cognitive Disability Correlation Chart
The statistical analysis conducted on geographies consisting of 572,255,575 people shows a poor positive correlation between the proportion of French and percentage of population with cognitive disability in the United States with a correlation coefficient (R) of 0.164 and weighted average of 17.0%. Similarly, the statistical analysis conducted on geographies consisting of 256,654,353 people shows a poor negative correlation between the proportion of Chileans and percentage of population with cognitive disability in the United States with a correlation coefficient (R) of -0.193 and weighted average of 17.0%, a difference of 0.0%.
Cognitive Disability Correlation Summary
| Measurement | French | Chilean |
| Minimum | 1.5% | 1.6% |
| Maximum | 54.8% | 22.9% |
| Range | 53.3% | 21.3% |
| Mean | 18.2% | 14.9% |
| Median | 17.0% | 15.4% |
| Interquartile 25% (IQ1) | 16.1% | 13.1% |
| Interquartile 75% (IQ3) | 18.2% | 17.3% |
| Interquartile Range (IQR) | 2.1% | 4.2% |
| Standard Deviation (Sample) | 8.8% | 4.1% |
| Standard Deviation (Population) | 8.7% | 4.1% |
Demographics Similar to French and Chileans by Cognitive Disability
In terms of cognitive disability, the demographic groups most similar to French are Aleut (17.0%, a difference of 0.0%), Carpatho Rusyn (17.0%, a difference of 0.030%), British (17.0%, a difference of 0.050%), Immigrants from Brazil (17.0%, a difference of 0.050%), and Welsh (17.0%, a difference of 0.070%). Similarly, the demographic groups most similar to Chileans are Aleut (17.0%, a difference of 0.0%), Carpatho Rusyn (17.0%, a difference of 0.030%), British (17.0%, a difference of 0.050%), Immigrants from Brazil (17.0%, a difference of 0.050%), and Welsh (17.0%, a difference of 0.070%).
| Demographics | Rating | Rank | Cognitive Disability |
| Immigrants | Uruguay | 92.9 /100 | #129 | Exceptional 17.0% |
| Immigrants | Vietnam | 92.4 /100 | #130 | Exceptional 17.0% |
| Immigrants | Germany | 92.1 /100 | #131 | Exceptional 17.0% |
| Whites/Caucasians | 92.1 /100 | #132 | Exceptional 17.0% |
| Immigrants | Jordan | 91.9 /100 | #133 | Exceptional 17.0% |
| Immigrants | Chile | 91.7 /100 | #134 | Exceptional 17.0% |
| Lebanese | 91.3 /100 | #135 | Exceptional 17.0% |
| Israelis | 91.0 /100 | #136 | Exceptional 17.0% |
| Immigrants | Norway | 90.9 /100 | #137 | Exceptional 17.0% |
| Welsh | 90.8 /100 | #138 | Exceptional 17.0% |
| French | 90.0 /100 | #139 | Excellent 17.0% |
| Chileans | 89.9 /100 | #140 | Excellent 17.0% |
| Aleuts | 89.9 /100 | #141 | Excellent 17.0% |
| Carpatho Rusyns | 89.6 /100 | #142 | Excellent 17.0% |
| British | 89.3 /100 | #143 | Excellent 17.0% |
| Immigrants | Brazil | 89.3 /100 | #144 | Excellent 17.0% |
| Immigrants | South Eastern Asia | 88.7 /100 | #145 | Excellent 17.0% |
| Costa Ricans | 88.0 /100 | #146 | Excellent 17.0% |
| Scotch-Irish | 85.9 /100 | #147 | Excellent 17.1% |
| French Canadians | 85.7 /100 | #148 | Excellent 17.1% |
| Cypriots | 85.7 /100 | #149 | Excellent 17.1% |