Scotch-Irish vs French American Indian Cognitive Disability
COMPARE
Scotch-Irish
French American Indian
Cognitive Disability
Cognitive Disability Comparison
Scotch-Irish
French American Indians
17.1%
COGNITIVE DISABILITY
85.9/ 100
METRIC RATING
147th/ 347
METRIC RANK
17.9%
COGNITIVE DISABILITY
0.7/ 100
METRIC RATING
248th/ 347
METRIC RANK
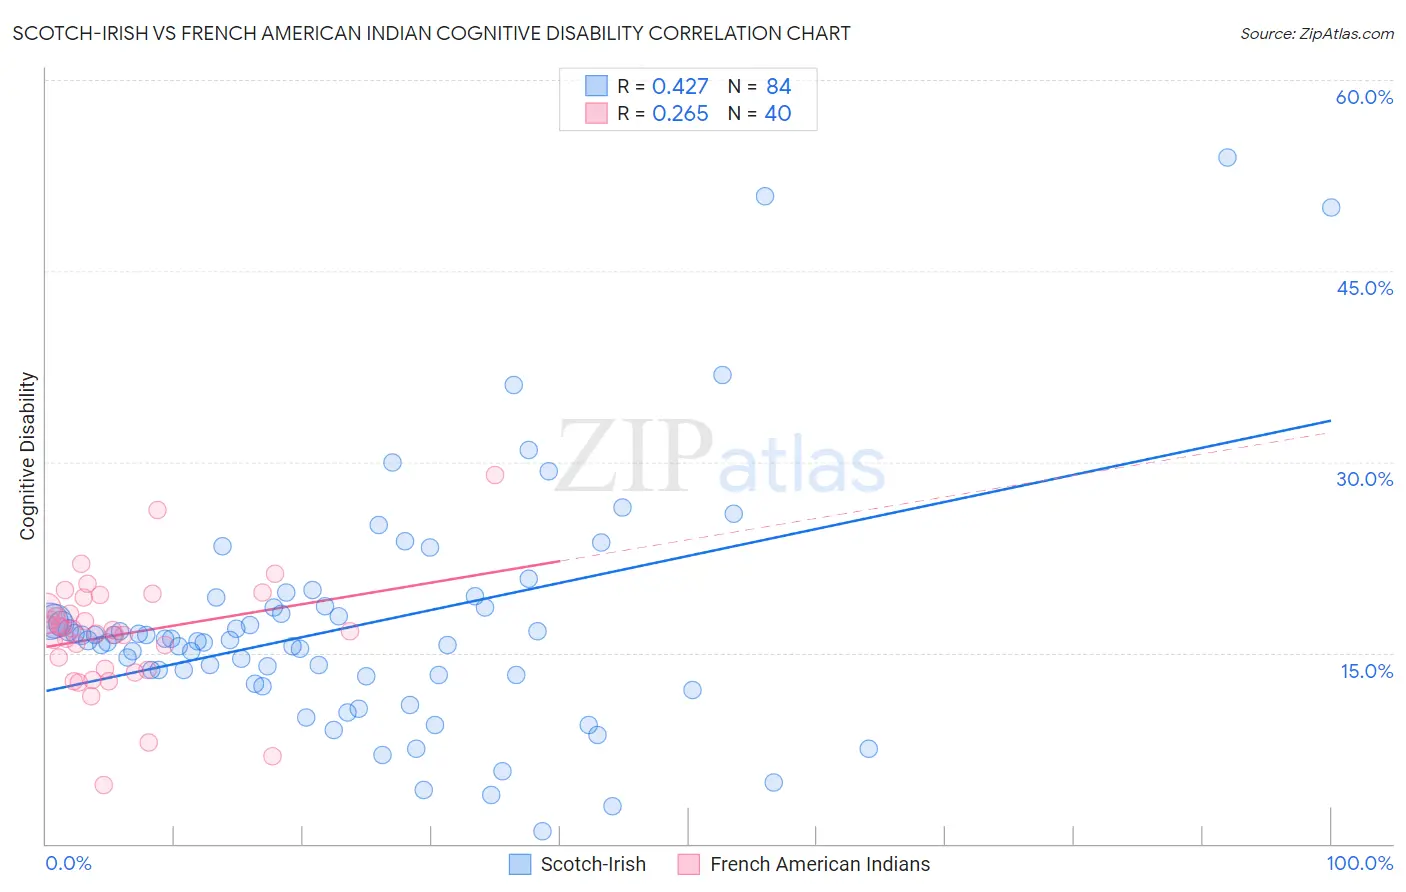
Scotch-Irish vs French American Indian Cognitive Disability Correlation Chart
The statistical analysis conducted on geographies consisting of 548,652,939 people shows a moderate positive correlation between the proportion of Scotch-Irish and percentage of population with cognitive disability in the United States with a correlation coefficient (R) of 0.427 and weighted average of 17.1%. Similarly, the statistical analysis conducted on geographies consisting of 131,963,087 people shows a weak positive correlation between the proportion of French American Indians and percentage of population with cognitive disability in the United States with a correlation coefficient (R) of 0.265 and weighted average of 17.9%, a difference of 4.9%.
Cognitive Disability Correlation Summary
| Measurement | Scotch-Irish | French American Indian |
| Minimum | 0.99% | 4.6% |
| Maximum | 53.9% | 28.9% |
| Range | 52.9% | 24.3% |
| Mean | 17.2% | 16.5% |
| Median | 16.0% | 16.7% |
| Interquartile 25% (IQ1) | 13.2% | 13.7% |
| Interquartile 75% (IQ3) | 18.6% | 19.0% |
| Interquartile Range (IQR) | 5.4% | 5.3% |
| Standard Deviation (Sample) | 9.4% | 4.5% |
| Standard Deviation (Population) | 9.3% | 4.5% |
Similar Demographics by Cognitive Disability
Demographics Similar to Scotch-Irish by Cognitive Disability
In terms of cognitive disability, the demographic groups most similar to Scotch-Irish are French Canadian (17.1%, a difference of 0.010%), Cypriot (17.1%, a difference of 0.010%), Basque (17.1%, a difference of 0.030%), Costa Rican (17.0%, a difference of 0.13%), and Syrian (17.1%, a difference of 0.16%).
| Demographics | Rating | Rank | Cognitive Disability |
| Chileans | 89.9 /100 | #140 | Excellent 17.0% |
| Aleuts | 89.9 /100 | #141 | Excellent 17.0% |
| Carpatho Rusyns | 89.6 /100 | #142 | Excellent 17.0% |
| British | 89.3 /100 | #143 | Excellent 17.0% |
| Immigrants | Brazil | 89.3 /100 | #144 | Excellent 17.0% |
| Immigrants | South Eastern Asia | 88.7 /100 | #145 | Excellent 17.0% |
| Costa Ricans | 88.0 /100 | #146 | Excellent 17.0% |
| Scotch-Irish | 85.9 /100 | #147 | Excellent 17.1% |
| French Canadians | 85.7 /100 | #148 | Excellent 17.1% |
| Cypriots | 85.7 /100 | #149 | Excellent 17.1% |
| Basques | 85.5 /100 | #150 | Excellent 17.1% |
| Syrians | 83.0 /100 | #151 | Excellent 17.1% |
| Immigrants | Indonesia | 82.7 /100 | #152 | Excellent 17.1% |
| Immigrants | Kazakhstan | 80.5 /100 | #153 | Excellent 17.1% |
| Immigrants | Malaysia | 79.3 /100 | #154 | Good 17.1% |
Demographics Similar to French American Indians by Cognitive Disability
In terms of cognitive disability, the demographic groups most similar to French American Indians are Samoan (17.9%, a difference of 0.010%), Cree (17.9%, a difference of 0.050%), Immigrants from Ethiopia (17.9%, a difference of 0.050%), Malaysian (17.9%, a difference of 0.060%), and Immigrants from Grenada (17.9%, a difference of 0.070%).
| Demographics | Rating | Rank | Cognitive Disability |
| Mexicans | 1.1 /100 | #241 | Tragic 17.8% |
| Paiute | 1.1 /100 | #242 | Tragic 17.8% |
| Immigrants | Bangladesh | 1.0 /100 | #243 | Tragic 17.8% |
| Jamaicans | 0.9 /100 | #244 | Tragic 17.9% |
| Trinidadians and Tobagonians | 0.8 /100 | #245 | Tragic 17.9% |
| Immigrants | Thailand | 0.8 /100 | #246 | Tragic 17.9% |
| Samoans | 0.7 /100 | #247 | Tragic 17.9% |
| French American Indians | 0.7 /100 | #248 | Tragic 17.9% |
| Cree | 0.7 /100 | #249 | Tragic 17.9% |
| Immigrants | Ethiopia | 0.7 /100 | #250 | Tragic 17.9% |
| Malaysians | 0.6 /100 | #251 | Tragic 17.9% |
| Immigrants | Grenada | 0.6 /100 | #252 | Tragic 17.9% |
| Hopi | 0.6 /100 | #253 | Tragic 17.9% |
| Hispanics or Latinos | 0.6 /100 | #254 | Tragic 17.9% |
| Immigrants | Azores | 0.6 /100 | #255 | Tragic 17.9% |