Immigrants from Burma/Myanmar vs Chilean Cognitive Disability
COMPARE
Immigrants from Burma/Myanmar
Chilean
Cognitive Disability
Cognitive Disability Comparison
Immigrants from Burma/Myanmar
Chileans
18.2%
COGNITIVE DISABILITY
0.0/ 100
METRIC RATING
296th/ 347
METRIC RANK
17.0%
COGNITIVE DISABILITY
89.9/ 100
METRIC RATING
140th/ 347
METRIC RANK
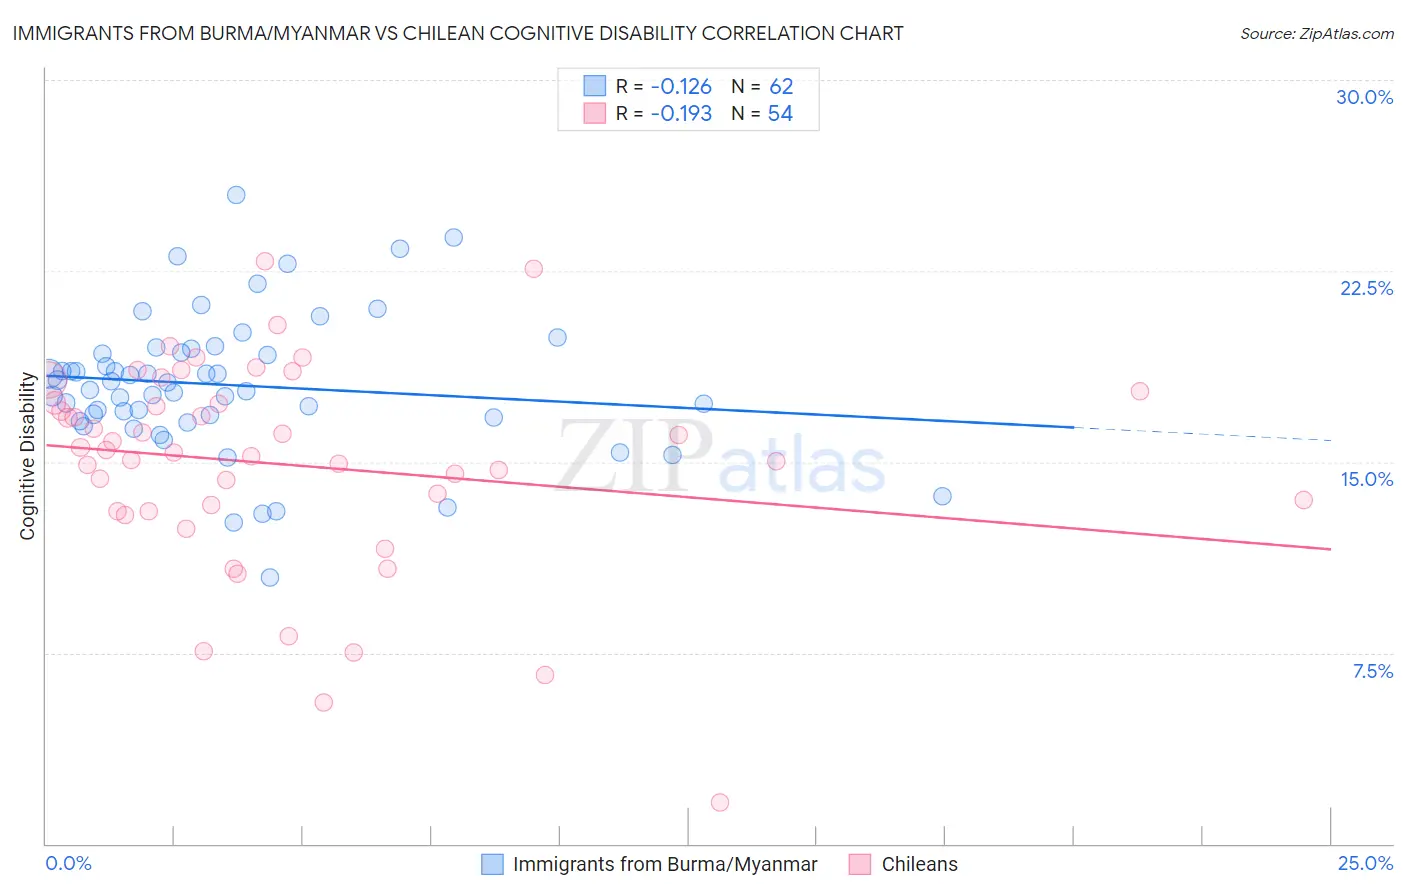
Immigrants from Burma/Myanmar vs Chilean Cognitive Disability Correlation Chart
The statistical analysis conducted on geographies consisting of 172,345,235 people shows a poor negative correlation between the proportion of Immigrants from Burma/Myanmar and percentage of population with cognitive disability in the United States with a correlation coefficient (R) of -0.126 and weighted average of 18.2%. Similarly, the statistical analysis conducted on geographies consisting of 256,654,353 people shows a poor negative correlation between the proportion of Chileans and percentage of population with cognitive disability in the United States with a correlation coefficient (R) of -0.193 and weighted average of 17.0%, a difference of 7.2%.
Cognitive Disability Correlation Summary
| Measurement | Immigrants from Burma/Myanmar | Chilean |
| Minimum | 10.5% | 1.6% |
| Maximum | 25.5% | 22.9% |
| Range | 15.0% | 21.3% |
| Mean | 18.0% | 14.9% |
| Median | 18.0% | 15.4% |
| Interquartile 25% (IQ1) | 16.7% | 13.1% |
| Interquartile 75% (IQ3) | 19.3% | 17.3% |
| Interquartile Range (IQR) | 2.6% | 4.2% |
| Standard Deviation (Sample) | 2.8% | 4.1% |
| Standard Deviation (Population) | 2.7% | 4.1% |
Similar Demographics by Cognitive Disability
Demographics Similar to Immigrants from Burma/Myanmar by Cognitive Disability
In terms of cognitive disability, the demographic groups most similar to Immigrants from Burma/Myanmar are German Russian (18.2%, a difference of 0.020%), Blackfeet (18.3%, a difference of 0.14%), Japanese (18.3%, a difference of 0.14%), Ghanaian (18.3%, a difference of 0.18%), and British West Indian (18.2%, a difference of 0.20%).
| Demographics | Rating | Rank | Cognitive Disability |
| Natives/Alaskans | 0.1 /100 | #289 | Tragic 18.1% |
| Immigrants | Africa | 0.1 /100 | #290 | Tragic 18.1% |
| Ottawa | 0.1 /100 | #291 | Tragic 18.2% |
| Iroquois | 0.1 /100 | #292 | Tragic 18.2% |
| Central American Indians | 0.1 /100 | #293 | Tragic 18.2% |
| British West Indians | 0.1 /100 | #294 | Tragic 18.2% |
| German Russians | 0.0 /100 | #295 | Tragic 18.2% |
| Immigrants | Burma/Myanmar | 0.0 /100 | #296 | Tragic 18.2% |
| Blackfeet | 0.0 /100 | #297 | Tragic 18.3% |
| Japanese | 0.0 /100 | #298 | Tragic 18.3% |
| Ghanaians | 0.0 /100 | #299 | Tragic 18.3% |
| Creek | 0.0 /100 | #300 | Tragic 18.3% |
| Immigrants | Ghana | 0.0 /100 | #301 | Tragic 18.3% |
| Barbadians | 0.0 /100 | #302 | Tragic 18.3% |
| Immigrants | Kenya | 0.0 /100 | #303 | Tragic 18.3% |
Demographics Similar to Chileans by Cognitive Disability
In terms of cognitive disability, the demographic groups most similar to Chileans are French (17.0%, a difference of 0.0%), Aleut (17.0%, a difference of 0.0%), Carpatho Rusyn (17.0%, a difference of 0.030%), British (17.0%, a difference of 0.050%), and Immigrants from Brazil (17.0%, a difference of 0.050%).
| Demographics | Rating | Rank | Cognitive Disability |
| Immigrants | Jordan | 91.9 /100 | #133 | Exceptional 17.0% |
| Immigrants | Chile | 91.7 /100 | #134 | Exceptional 17.0% |
| Lebanese | 91.3 /100 | #135 | Exceptional 17.0% |
| Israelis | 91.0 /100 | #136 | Exceptional 17.0% |
| Immigrants | Norway | 90.9 /100 | #137 | Exceptional 17.0% |
| Welsh | 90.8 /100 | #138 | Exceptional 17.0% |
| French | 90.0 /100 | #139 | Excellent 17.0% |
| Chileans | 89.9 /100 | #140 | Excellent 17.0% |
| Aleuts | 89.9 /100 | #141 | Excellent 17.0% |
| Carpatho Rusyns | 89.6 /100 | #142 | Excellent 17.0% |
| British | 89.3 /100 | #143 | Excellent 17.0% |
| Immigrants | Brazil | 89.3 /100 | #144 | Excellent 17.0% |
| Immigrants | South Eastern Asia | 88.7 /100 | #145 | Excellent 17.0% |
| Costa Ricans | 88.0 /100 | #146 | Excellent 17.0% |
| Scotch-Irish | 85.9 /100 | #147 | Excellent 17.1% |