Scotch-Irish vs Alsatian Cognitive Disability
COMPARE
Scotch-Irish
Alsatian
Cognitive Disability
Cognitive Disability Comparison
Scotch-Irish
Alsatians
17.1%
COGNITIVE DISABILITY
85.9/ 100
METRIC RATING
147th/ 347
METRIC RANK
17.7%
COGNITIVE DISABILITY
4.5/ 100
METRIC RATING
223rd/ 347
METRIC RANK
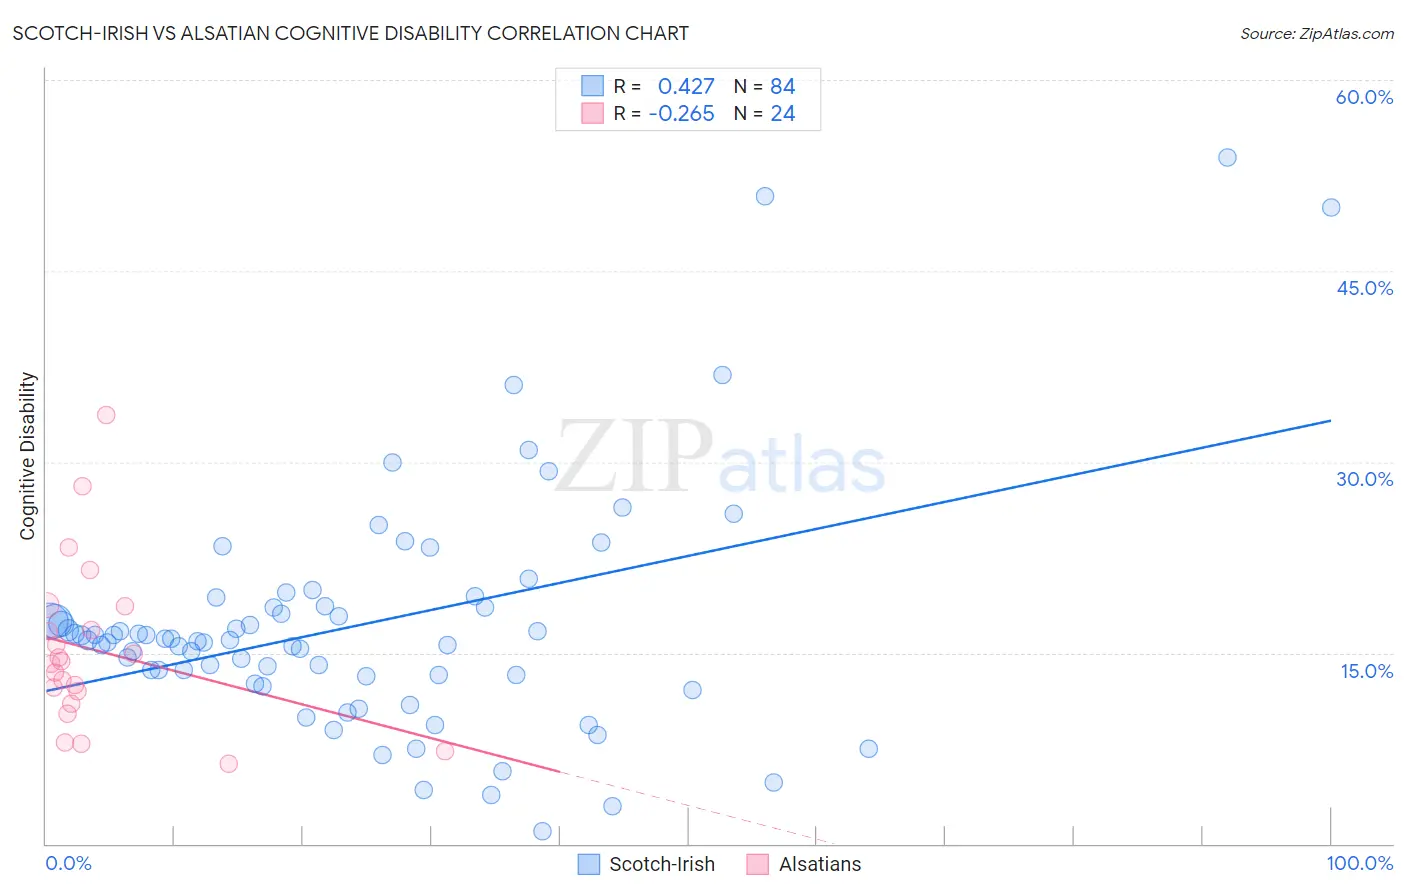
Scotch-Irish vs Alsatian Cognitive Disability Correlation Chart
The statistical analysis conducted on geographies consisting of 548,652,939 people shows a moderate positive correlation between the proportion of Scotch-Irish and percentage of population with cognitive disability in the United States with a correlation coefficient (R) of 0.427 and weighted average of 17.1%. Similarly, the statistical analysis conducted on geographies consisting of 82,682,247 people shows a weak negative correlation between the proportion of Alsatians and percentage of population with cognitive disability in the United States with a correlation coefficient (R) of -0.265 and weighted average of 17.7%, a difference of 3.5%.
Cognitive Disability Correlation Summary
| Measurement | Scotch-Irish | Alsatian |
| Minimum | 0.99% | 6.2% |
| Maximum | 53.9% | 33.7% |
| Range | 52.9% | 27.5% |
| Mean | 17.2% | 15.2% |
| Median | 16.0% | 14.3% |
| Interquartile 25% (IQ1) | 13.2% | 11.5% |
| Interquartile 75% (IQ3) | 18.6% | 17.7% |
| Interquartile Range (IQR) | 5.4% | 6.2% |
| Standard Deviation (Sample) | 9.4% | 6.5% |
| Standard Deviation (Population) | 9.3% | 6.4% |
Similar Demographics by Cognitive Disability
Demographics Similar to Scotch-Irish by Cognitive Disability
In terms of cognitive disability, the demographic groups most similar to Scotch-Irish are French Canadian (17.1%, a difference of 0.010%), Cypriot (17.1%, a difference of 0.010%), Basque (17.1%, a difference of 0.030%), Costa Rican (17.0%, a difference of 0.13%), and Syrian (17.1%, a difference of 0.16%).
| Demographics | Rating | Rank | Cognitive Disability |
| Chileans | 89.9 /100 | #140 | Excellent 17.0% |
| Aleuts | 89.9 /100 | #141 | Excellent 17.0% |
| Carpatho Rusyns | 89.6 /100 | #142 | Excellent 17.0% |
| British | 89.3 /100 | #143 | Excellent 17.0% |
| Immigrants | Brazil | 89.3 /100 | #144 | Excellent 17.0% |
| Immigrants | South Eastern Asia | 88.7 /100 | #145 | Excellent 17.0% |
| Costa Ricans | 88.0 /100 | #146 | Excellent 17.0% |
| Scotch-Irish | 85.9 /100 | #147 | Excellent 17.1% |
| French Canadians | 85.7 /100 | #148 | Excellent 17.1% |
| Cypriots | 85.7 /100 | #149 | Excellent 17.1% |
| Basques | 85.5 /100 | #150 | Excellent 17.1% |
| Syrians | 83.0 /100 | #151 | Excellent 17.1% |
| Immigrants | Indonesia | 82.7 /100 | #152 | Excellent 17.1% |
| Immigrants | Kazakhstan | 80.5 /100 | #153 | Excellent 17.1% |
| Immigrants | Malaysia | 79.3 /100 | #154 | Good 17.1% |
Demographics Similar to Alsatians by Cognitive Disability
In terms of cognitive disability, the demographic groups most similar to Alsatians are Central American (17.7%, a difference of 0.010%), Fijian (17.7%, a difference of 0.19%), Vietnamese (17.7%, a difference of 0.20%), Moroccan (17.6%, a difference of 0.21%), and Zimbabwean (17.6%, a difference of 0.22%).
| Demographics | Rating | Rank | Cognitive Disability |
| Okinawans | 6.8 /100 | #216 | Tragic 17.6% |
| Salvadorans | 6.7 /100 | #217 | Tragic 17.6% |
| Icelanders | 6.4 /100 | #218 | Tragic 17.6% |
| Immigrants | Sierra Leone | 6.3 /100 | #219 | Tragic 17.6% |
| Zimbabweans | 6.1 /100 | #220 | Tragic 17.6% |
| Moroccans | 5.9 /100 | #221 | Tragic 17.6% |
| Central Americans | 4.5 /100 | #222 | Tragic 17.7% |
| Alsatians | 4.5 /100 | #223 | Tragic 17.7% |
| Fijians | 3.4 /100 | #224 | Tragic 17.7% |
| Vietnamese | 3.4 /100 | #225 | Tragic 17.7% |
| Marshallese | 2.7 /100 | #226 | Tragic 17.7% |
| Immigrants | St. Vincent and the Grenadines | 2.6 /100 | #227 | Tragic 17.7% |
| Immigrants | Central America | 2.3 /100 | #228 | Tragic 17.7% |
| Immigrants | Guatemala | 2.2 /100 | #229 | Tragic 17.7% |
| Mongolians | 2.2 /100 | #230 | Tragic 17.7% |