Sierra Leonean vs Chilean Cognitive Disability
COMPARE
Sierra Leonean
Chilean
Cognitive Disability
Cognitive Disability Comparison
Sierra Leoneans
Chileans
17.9%
COGNITIVE DISABILITY
0.4/ 100
METRIC RATING
262nd/ 347
METRIC RANK
17.0%
COGNITIVE DISABILITY
89.9/ 100
METRIC RATING
140th/ 347
METRIC RANK
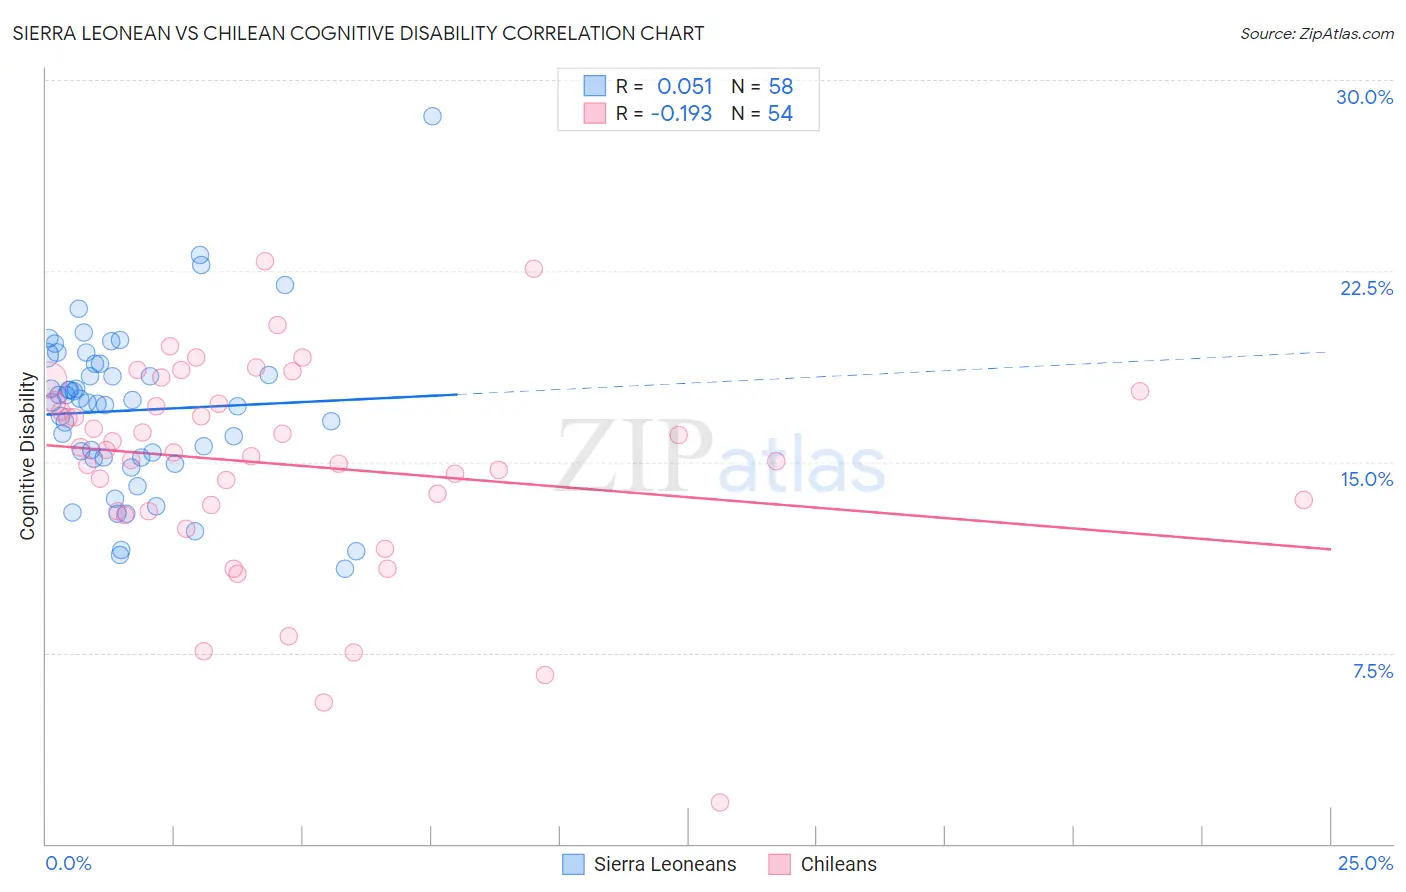
Sierra Leonean vs Chilean Cognitive Disability Correlation Chart
The statistical analysis conducted on geographies consisting of 83,361,112 people shows a slight positive correlation between the proportion of Sierra Leoneans and percentage of population with cognitive disability in the United States with a correlation coefficient (R) of 0.051 and weighted average of 17.9%. Similarly, the statistical analysis conducted on geographies consisting of 256,654,353 people shows a poor negative correlation between the proportion of Chileans and percentage of population with cognitive disability in the United States with a correlation coefficient (R) of -0.193 and weighted average of 17.0%, a difference of 5.5%.
Cognitive Disability Correlation Summary
| Measurement | Sierra Leonean | Chilean |
| Minimum | 10.8% | 1.6% |
| Maximum | 28.6% | 22.9% |
| Range | 17.8% | 21.3% |
| Mean | 17.0% | 14.9% |
| Median | 17.3% | 15.4% |
| Interquartile 25% (IQ1) | 15.2% | 13.1% |
| Interquartile 75% (IQ3) | 18.8% | 17.3% |
| Interquartile Range (IQR) | 3.7% | 4.2% |
| Standard Deviation (Sample) | 3.2% | 4.1% |
| Standard Deviation (Population) | 3.2% | 4.1% |
Similar Demographics by Cognitive Disability
Demographics Similar to Sierra Leoneans by Cognitive Disability
In terms of cognitive disability, the demographic groups most similar to Sierra Leoneans are Guamanian/Chamorro (17.9%, a difference of 0.030%), Immigrants from Barbados (17.9%, a difference of 0.040%), Immigrants from Belize (17.9%, a difference of 0.080%), Ethiopian (17.9%, a difference of 0.090%), and Menominee (18.0%, a difference of 0.10%).
| Demographics | Rating | Rank | Cognitive Disability |
| Immigrants | Azores | 0.6 /100 | #255 | Tragic 17.9% |
| Bahamians | 0.6 /100 | #256 | Tragic 17.9% |
| Mexican American Indians | 0.6 /100 | #257 | Tragic 17.9% |
| Immigrants | Armenia | 0.6 /100 | #258 | Tragic 17.9% |
| Ethiopians | 0.5 /100 | #259 | Tragic 17.9% |
| Immigrants | Belize | 0.5 /100 | #260 | Tragic 17.9% |
| Guamanians/Chamorros | 0.5 /100 | #261 | Tragic 17.9% |
| Sierra Leoneans | 0.4 /100 | #262 | Tragic 17.9% |
| Immigrants | Barbados | 0.4 /100 | #263 | Tragic 17.9% |
| Menominee | 0.4 /100 | #264 | Tragic 18.0% |
| Spanish Americans | 0.4 /100 | #265 | Tragic 18.0% |
| Belizeans | 0.4 /100 | #266 | Tragic 18.0% |
| Nepalese | 0.3 /100 | #267 | Tragic 18.0% |
| Cherokee | 0.3 /100 | #268 | Tragic 18.0% |
| Hondurans | 0.3 /100 | #269 | Tragic 18.0% |
Demographics Similar to Chileans by Cognitive Disability
In terms of cognitive disability, the demographic groups most similar to Chileans are French (17.0%, a difference of 0.0%), Aleut (17.0%, a difference of 0.0%), Carpatho Rusyn (17.0%, a difference of 0.030%), British (17.0%, a difference of 0.050%), and Immigrants from Brazil (17.0%, a difference of 0.050%).
| Demographics | Rating | Rank | Cognitive Disability |
| Immigrants | Jordan | 91.9 /100 | #133 | Exceptional 17.0% |
| Immigrants | Chile | 91.7 /100 | #134 | Exceptional 17.0% |
| Lebanese | 91.3 /100 | #135 | Exceptional 17.0% |
| Israelis | 91.0 /100 | #136 | Exceptional 17.0% |
| Immigrants | Norway | 90.9 /100 | #137 | Exceptional 17.0% |
| Welsh | 90.8 /100 | #138 | Exceptional 17.0% |
| French | 90.0 /100 | #139 | Excellent 17.0% |
| Chileans | 89.9 /100 | #140 | Excellent 17.0% |
| Aleuts | 89.9 /100 | #141 | Excellent 17.0% |
| Carpatho Rusyns | 89.6 /100 | #142 | Excellent 17.0% |
| British | 89.3 /100 | #143 | Excellent 17.0% |
| Immigrants | Brazil | 89.3 /100 | #144 | Excellent 17.0% |
| Immigrants | South Eastern Asia | 88.7 /100 | #145 | Excellent 17.0% |
| Costa Ricans | 88.0 /100 | #146 | Excellent 17.0% |
| Scotch-Irish | 85.9 /100 | #147 | Excellent 17.1% |