Tongan vs Chilean Cognitive Disability
COMPARE
Tongan
Chilean
Cognitive Disability
Cognitive Disability Comparison
Tongans
Chileans
17.8%
COGNITIVE DISABILITY
2.1/ 100
METRIC RATING
232nd/ 347
METRIC RANK
17.0%
COGNITIVE DISABILITY
89.9/ 100
METRIC RATING
140th/ 347
METRIC RANK
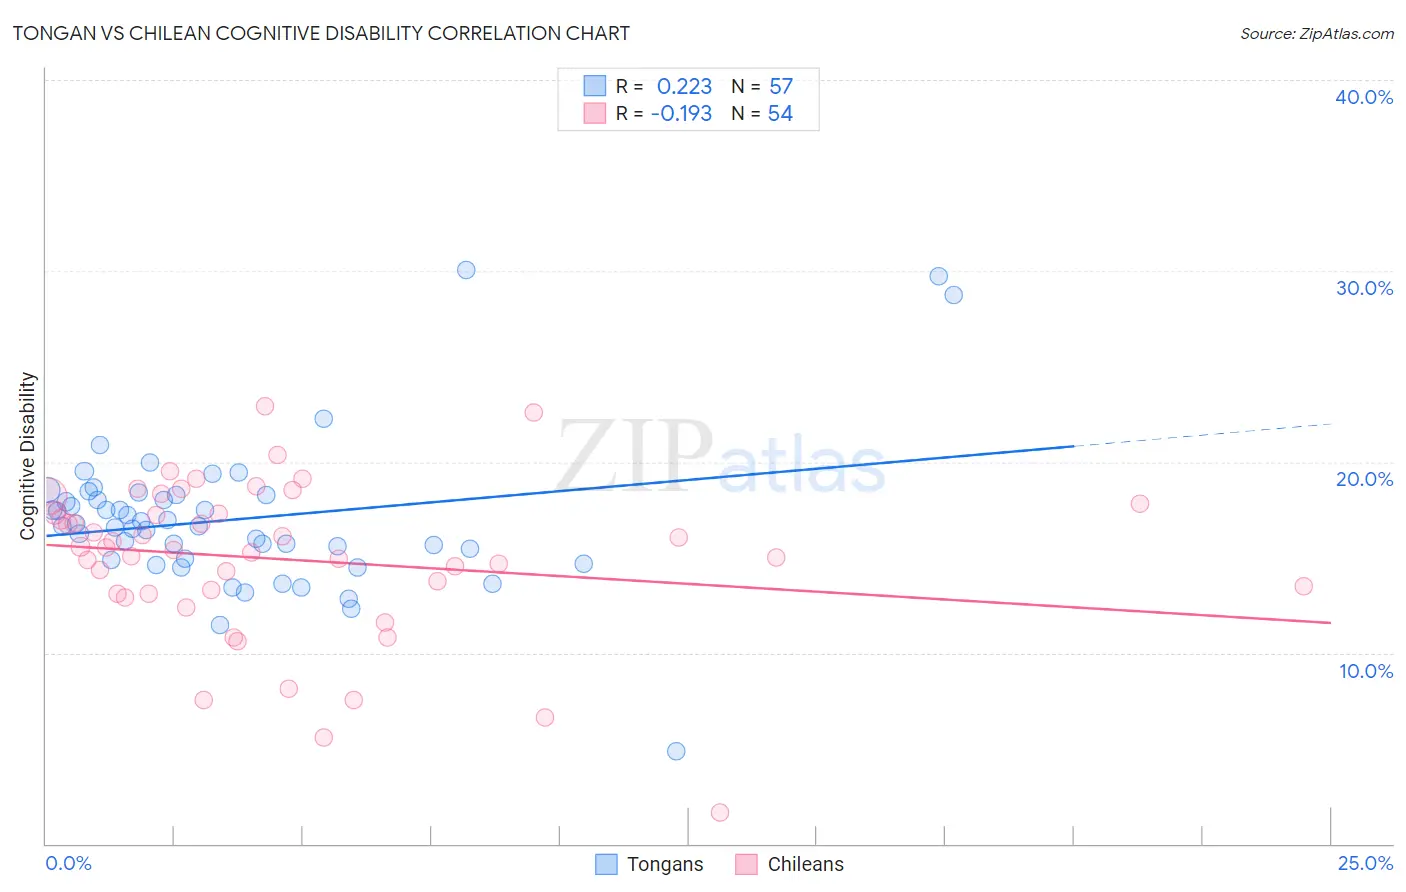
Tongan vs Chilean Cognitive Disability Correlation Chart
The statistical analysis conducted on geographies consisting of 102,895,026 people shows a weak positive correlation between the proportion of Tongans and percentage of population with cognitive disability in the United States with a correlation coefficient (R) of 0.223 and weighted average of 17.8%. Similarly, the statistical analysis conducted on geographies consisting of 256,654,353 people shows a poor negative correlation between the proportion of Chileans and percentage of population with cognitive disability in the United States with a correlation coefficient (R) of -0.193 and weighted average of 17.0%, a difference of 4.4%.
Cognitive Disability Correlation Summary
| Measurement | Tongan | Chilean |
| Minimum | 4.8% | 1.6% |
| Maximum | 30.0% | 22.9% |
| Range | 25.2% | 21.3% |
| Mean | 17.0% | 14.9% |
| Median | 16.6% | 15.4% |
| Interquartile 25% (IQ1) | 14.9% | 13.1% |
| Interquartile 75% (IQ3) | 18.3% | 17.3% |
| Interquartile Range (IQR) | 3.4% | 4.2% |
| Standard Deviation (Sample) | 4.0% | 4.1% |
| Standard Deviation (Population) | 3.9% | 4.1% |
Similar Demographics by Cognitive Disability
Demographics Similar to Tongans by Cognitive Disability
In terms of cognitive disability, the demographic groups most similar to Tongans are Guatemalan (17.8%, a difference of 0.0%), Panamanian (17.8%, a difference of 0.0%), Osage (17.8%, a difference of 0.020%), Spanish American Indian (17.8%, a difference of 0.020%), and Mongolian (17.7%, a difference of 0.030%).
| Demographics | Rating | Rank | Cognitive Disability |
| Vietnamese | 3.4 /100 | #225 | Tragic 17.7% |
| Marshallese | 2.7 /100 | #226 | Tragic 17.7% |
| Immigrants | St. Vincent and the Grenadines | 2.6 /100 | #227 | Tragic 17.7% |
| Immigrants | Central America | 2.3 /100 | #228 | Tragic 17.7% |
| Immigrants | Guatemala | 2.2 /100 | #229 | Tragic 17.7% |
| Mongolians | 2.2 /100 | #230 | Tragic 17.7% |
| Guatemalans | 2.1 /100 | #231 | Tragic 17.8% |
| Tongans | 2.1 /100 | #232 | Tragic 17.8% |
| Panamanians | 2.1 /100 | #233 | Tragic 17.8% |
| Osage | 2.0 /100 | #234 | Tragic 17.8% |
| Spanish American Indians | 2.0 /100 | #235 | Tragic 17.8% |
| Immigrants | Iraq | 1.8 /100 | #236 | Tragic 17.8% |
| Immigrants | Mexico | 1.8 /100 | #237 | Tragic 17.8% |
| Cheyenne | 1.7 /100 | #238 | Tragic 17.8% |
| Cajuns | 1.4 /100 | #239 | Tragic 17.8% |
Demographics Similar to Chileans by Cognitive Disability
In terms of cognitive disability, the demographic groups most similar to Chileans are French (17.0%, a difference of 0.0%), Aleut (17.0%, a difference of 0.0%), Carpatho Rusyn (17.0%, a difference of 0.030%), British (17.0%, a difference of 0.050%), and Immigrants from Brazil (17.0%, a difference of 0.050%).
| Demographics | Rating | Rank | Cognitive Disability |
| Immigrants | Jordan | 91.9 /100 | #133 | Exceptional 17.0% |
| Immigrants | Chile | 91.7 /100 | #134 | Exceptional 17.0% |
| Lebanese | 91.3 /100 | #135 | Exceptional 17.0% |
| Israelis | 91.0 /100 | #136 | Exceptional 17.0% |
| Immigrants | Norway | 90.9 /100 | #137 | Exceptional 17.0% |
| Welsh | 90.8 /100 | #138 | Exceptional 17.0% |
| French | 90.0 /100 | #139 | Excellent 17.0% |
| Chileans | 89.9 /100 | #140 | Excellent 17.0% |
| Aleuts | 89.9 /100 | #141 | Excellent 17.0% |
| Carpatho Rusyns | 89.6 /100 | #142 | Excellent 17.0% |
| British | 89.3 /100 | #143 | Excellent 17.0% |
| Immigrants | Brazil | 89.3 /100 | #144 | Excellent 17.0% |
| Immigrants | South Eastern Asia | 88.7 /100 | #145 | Excellent 17.0% |
| Costa Ricans | 88.0 /100 | #146 | Excellent 17.0% |
| Scotch-Irish | 85.9 /100 | #147 | Excellent 17.1% |