Immigrants from Ecuador vs Chilean Cognitive Disability
COMPARE
Immigrants from Ecuador
Chilean
Cognitive Disability
Cognitive Disability Comparison
Immigrants from Ecuador
Chileans
17.2%
COGNITIVE DISABILITY
64.4/ 100
METRIC RATING
166th/ 347
METRIC RANK
17.0%
COGNITIVE DISABILITY
89.9/ 100
METRIC RATING
140th/ 347
METRIC RANK
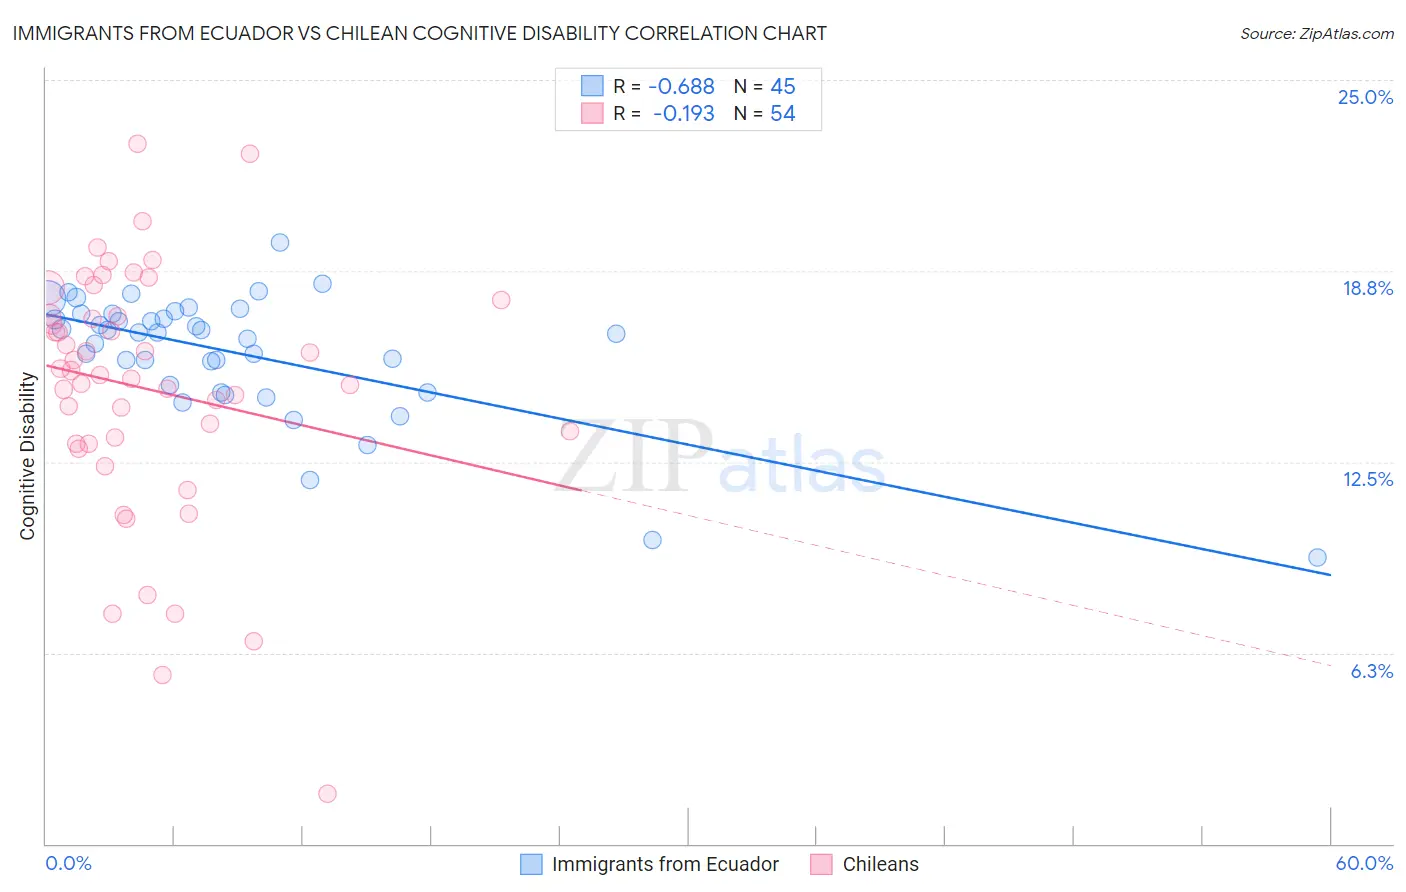
Immigrants from Ecuador vs Chilean Cognitive Disability Correlation Chart
The statistical analysis conducted on geographies consisting of 270,972,239 people shows a significant negative correlation between the proportion of Immigrants from Ecuador and percentage of population with cognitive disability in the United States with a correlation coefficient (R) of -0.688 and weighted average of 17.2%. Similarly, the statistical analysis conducted on geographies consisting of 256,654,353 people shows a poor negative correlation between the proportion of Chileans and percentage of population with cognitive disability in the United States with a correlation coefficient (R) of -0.193 and weighted average of 17.0%, a difference of 1.1%.
Cognitive Disability Correlation Summary
| Measurement | Immigrants from Ecuador | Chilean |
| Minimum | 9.4% | 1.6% |
| Maximum | 19.7% | 22.9% |
| Range | 10.3% | 21.3% |
| Mean | 16.1% | 14.9% |
| Median | 16.7% | 15.4% |
| Interquartile 25% (IQ1) | 14.9% | 13.1% |
| Interquartile 75% (IQ3) | 17.3% | 17.3% |
| Interquartile Range (IQR) | 2.4% | 4.2% |
| Standard Deviation (Sample) | 2.0% | 4.1% |
| Standard Deviation (Population) | 2.0% | 4.1% |
Similar Demographics by Cognitive Disability
Demographics Similar to Immigrants from Ecuador by Cognitive Disability
In terms of cognitive disability, the demographic groups most similar to Immigrants from Ecuador are Immigrants from Albania (17.2%, a difference of 0.010%), Immigrants from Syria (17.2%, a difference of 0.030%), Immigrants (17.2%, a difference of 0.060%), Immigrants from Portugal (17.2%, a difference of 0.080%), and Ecuadorian (17.2%, a difference of 0.15%).
| Demographics | Rating | Rank | Cognitive Disability |
| Immigrants | Latvia | 73.2 /100 | #159 | Good 17.2% |
| Australians | 72.4 /100 | #160 | Good 17.2% |
| Americans | 72.2 /100 | #161 | Good 17.2% |
| Yugoslavians | 71.6 /100 | #162 | Good 17.2% |
| Immigrants | Switzerland | 71.5 /100 | #163 | Good 17.2% |
| Armenians | 70.1 /100 | #164 | Good 17.2% |
| Immigrants | Albania | 64.9 /100 | #165 | Good 17.2% |
| Immigrants | Ecuador | 64.4 /100 | #166 | Good 17.2% |
| Immigrants | Syria | 63.5 /100 | #167 | Good 17.2% |
| Immigrants | Immigrants | 62.5 /100 | #168 | Good 17.2% |
| Immigrants | Portugal | 61.8 /100 | #169 | Good 17.2% |
| Ecuadorians | 59.6 /100 | #170 | Average 17.2% |
| Tlingit-Haida | 59.4 /100 | #171 | Average 17.2% |
| Immigrants | Turkey | 56.7 /100 | #172 | Average 17.2% |
| Immigrants | Northern Africa | 50.2 /100 | #173 | Average 17.3% |
Demographics Similar to Chileans by Cognitive Disability
In terms of cognitive disability, the demographic groups most similar to Chileans are French (17.0%, a difference of 0.0%), Aleut (17.0%, a difference of 0.0%), Carpatho Rusyn (17.0%, a difference of 0.030%), British (17.0%, a difference of 0.050%), and Immigrants from Brazil (17.0%, a difference of 0.050%).
| Demographics | Rating | Rank | Cognitive Disability |
| Immigrants | Jordan | 91.9 /100 | #133 | Exceptional 17.0% |
| Immigrants | Chile | 91.7 /100 | #134 | Exceptional 17.0% |
| Lebanese | 91.3 /100 | #135 | Exceptional 17.0% |
| Israelis | 91.0 /100 | #136 | Exceptional 17.0% |
| Immigrants | Norway | 90.9 /100 | #137 | Exceptional 17.0% |
| Welsh | 90.8 /100 | #138 | Exceptional 17.0% |
| French | 90.0 /100 | #139 | Excellent 17.0% |
| Chileans | 89.9 /100 | #140 | Excellent 17.0% |
| Aleuts | 89.9 /100 | #141 | Excellent 17.0% |
| Carpatho Rusyns | 89.6 /100 | #142 | Excellent 17.0% |
| British | 89.3 /100 | #143 | Excellent 17.0% |
| Immigrants | Brazil | 89.3 /100 | #144 | Excellent 17.0% |
| Immigrants | South Eastern Asia | 88.7 /100 | #145 | Excellent 17.0% |
| Costa Ricans | 88.0 /100 | #146 | Excellent 17.0% |
| Scotch-Irish | 85.9 /100 | #147 | Excellent 17.1% |