Scotch-Irish vs Immigrants from Northern Europe Cognitive Disability
COMPARE
Scotch-Irish
Immigrants from Northern Europe
Cognitive Disability
Cognitive Disability Comparison
Scotch-Irish
Immigrants from Northern Europe
17.1%
COGNITIVE DISABILITY
85.9/ 100
METRIC RATING
147th/ 347
METRIC RANK
16.3%
COGNITIVE DISABILITY
100.0/ 100
METRIC RATING
18th/ 347
METRIC RANK
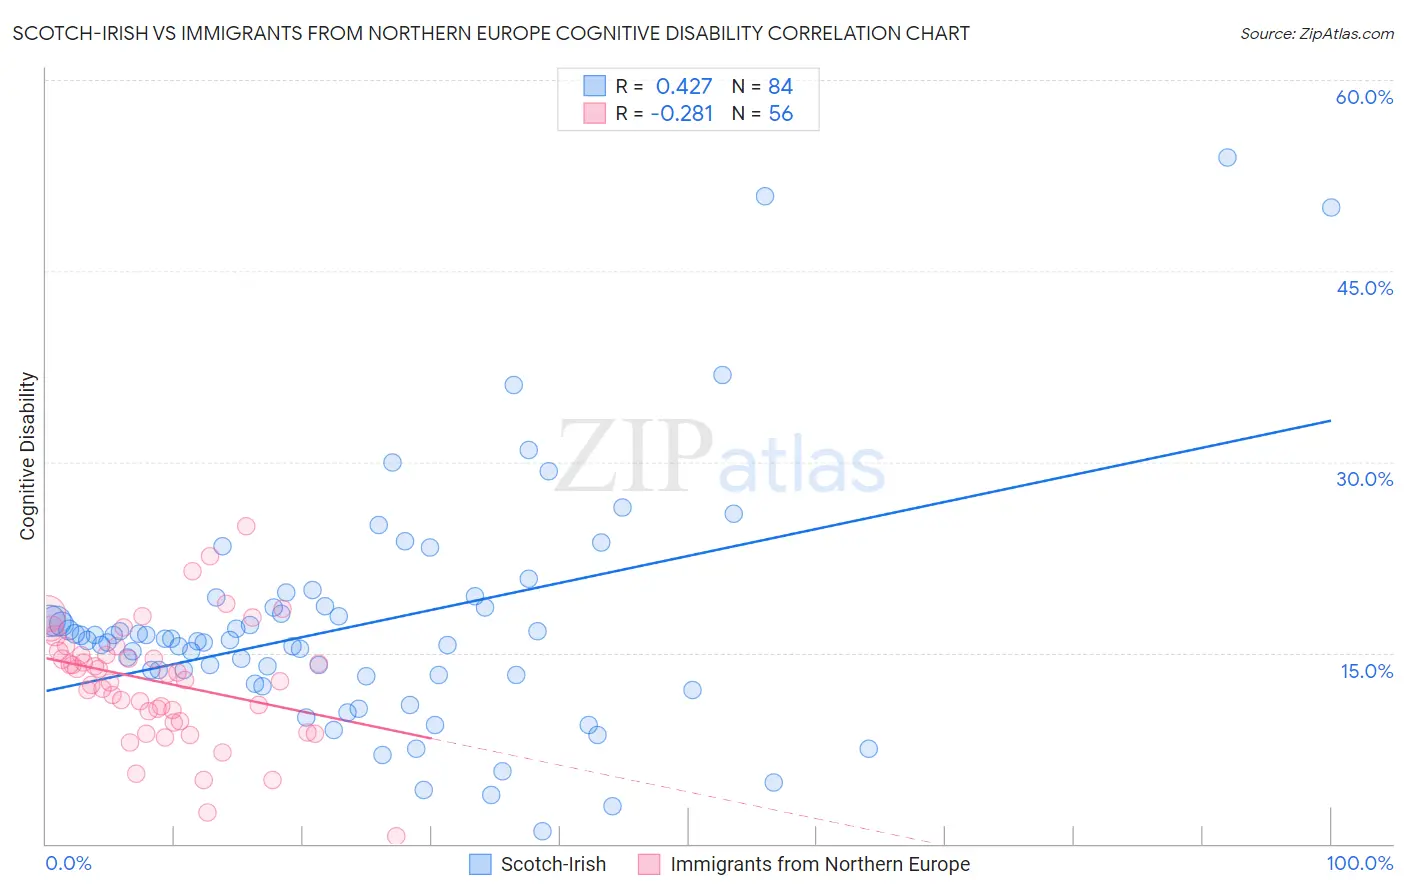
Scotch-Irish vs Immigrants from Northern Europe Cognitive Disability Correlation Chart
The statistical analysis conducted on geographies consisting of 548,652,939 people shows a moderate positive correlation between the proportion of Scotch-Irish and percentage of population with cognitive disability in the United States with a correlation coefficient (R) of 0.427 and weighted average of 17.1%. Similarly, the statistical analysis conducted on geographies consisting of 477,209,929 people shows a weak negative correlation between the proportion of Immigrants from Northern Europe and percentage of population with cognitive disability in the United States with a correlation coefficient (R) of -0.281 and weighted average of 16.3%, a difference of 4.4%.
Cognitive Disability Correlation Summary
| Measurement | Scotch-Irish | Immigrants from Northern Europe |
| Minimum | 0.99% | 0.61% |
| Maximum | 53.9% | 24.9% |
| Range | 52.9% | 24.3% |
| Mean | 17.2% | 12.7% |
| Median | 16.0% | 13.1% |
| Interquartile 25% (IQ1) | 13.2% | 10.0% |
| Interquartile 75% (IQ3) | 18.6% | 15.0% |
| Interquartile Range (IQR) | 5.4% | 5.0% |
| Standard Deviation (Sample) | 9.4% | 4.6% |
| Standard Deviation (Population) | 9.3% | 4.6% |
Similar Demographics by Cognitive Disability
Demographics Similar to Scotch-Irish by Cognitive Disability
In terms of cognitive disability, the demographic groups most similar to Scotch-Irish are French Canadian (17.1%, a difference of 0.010%), Cypriot (17.1%, a difference of 0.010%), Basque (17.1%, a difference of 0.030%), Costa Rican (17.0%, a difference of 0.13%), and Syrian (17.1%, a difference of 0.16%).
| Demographics | Rating | Rank | Cognitive Disability |
| Chileans | 89.9 /100 | #140 | Excellent 17.0% |
| Aleuts | 89.9 /100 | #141 | Excellent 17.0% |
| Carpatho Rusyns | 89.6 /100 | #142 | Excellent 17.0% |
| British | 89.3 /100 | #143 | Excellent 17.0% |
| Immigrants | Brazil | 89.3 /100 | #144 | Excellent 17.0% |
| Immigrants | South Eastern Asia | 88.7 /100 | #145 | Excellent 17.0% |
| Costa Ricans | 88.0 /100 | #146 | Excellent 17.0% |
| Scotch-Irish | 85.9 /100 | #147 | Excellent 17.1% |
| French Canadians | 85.7 /100 | #148 | Excellent 17.1% |
| Cypriots | 85.7 /100 | #149 | Excellent 17.1% |
| Basques | 85.5 /100 | #150 | Excellent 17.1% |
| Syrians | 83.0 /100 | #151 | Excellent 17.1% |
| Immigrants | Indonesia | 82.7 /100 | #152 | Excellent 17.1% |
| Immigrants | Kazakhstan | 80.5 /100 | #153 | Excellent 17.1% |
| Immigrants | Malaysia | 79.3 /100 | #154 | Good 17.1% |
Demographics Similar to Immigrants from Northern Europe by Cognitive Disability
In terms of cognitive disability, the demographic groups most similar to Immigrants from Northern Europe are Immigrants from Bolivia (16.3%, a difference of 0.0%), Bulgarian (16.3%, a difference of 0.020%), Immigrants from North Macedonia (16.3%, a difference of 0.060%), Immigrants from Cuba (16.3%, a difference of 0.060%), and Eastern European (16.3%, a difference of 0.080%).
| Demographics | Rating | Rank | Cognitive Disability |
| Immigrants | Czechoslovakia | 100.0 /100 | #11 | Exceptional 16.2% |
| Maltese | 100.0 /100 | #12 | Exceptional 16.2% |
| Lithuanians | 100.0 /100 | #13 | Exceptional 16.3% |
| Immigrants | Austria | 100.0 /100 | #14 | Exceptional 16.3% |
| Immigrants | Greece | 100.0 /100 | #15 | Exceptional 16.3% |
| Eastern Europeans | 100.0 /100 | #16 | Exceptional 16.3% |
| Immigrants | North Macedonia | 100.0 /100 | #17 | Exceptional 16.3% |
| Immigrants | Northern Europe | 100.0 /100 | #18 | Exceptional 16.3% |
| Immigrants | Bolivia | 100.0 /100 | #19 | Exceptional 16.3% |
| Bulgarians | 100.0 /100 | #20 | Exceptional 16.3% |
| Immigrants | Cuba | 100.0 /100 | #21 | Exceptional 16.3% |
| Immigrants | South Central Asia | 99.9 /100 | #22 | Exceptional 16.4% |
| Croatians | 99.9 /100 | #23 | Exceptional 16.4% |
| Immigrants | Argentina | 99.9 /100 | #24 | Exceptional 16.4% |
| Luxembourgers | 99.9 /100 | #25 | Exceptional 16.4% |