Immigrants from Oceania vs Dutch Disability Age 5 to 17
COMPARE
Immigrants from Oceania
Dutch
Disability Age 5 to 17
Disability Age 5 to 17 Comparison
Immigrants from Oceania
Dutch
5.4%
DISABILITY AGE 5 TO 17
90.8/ 100
METRIC RATING
138th/ 347
METRIC RANK
6.0%
DISABILITY AGE 5 TO 17
0.2/ 100
METRIC RATING
275th/ 347
METRIC RANK
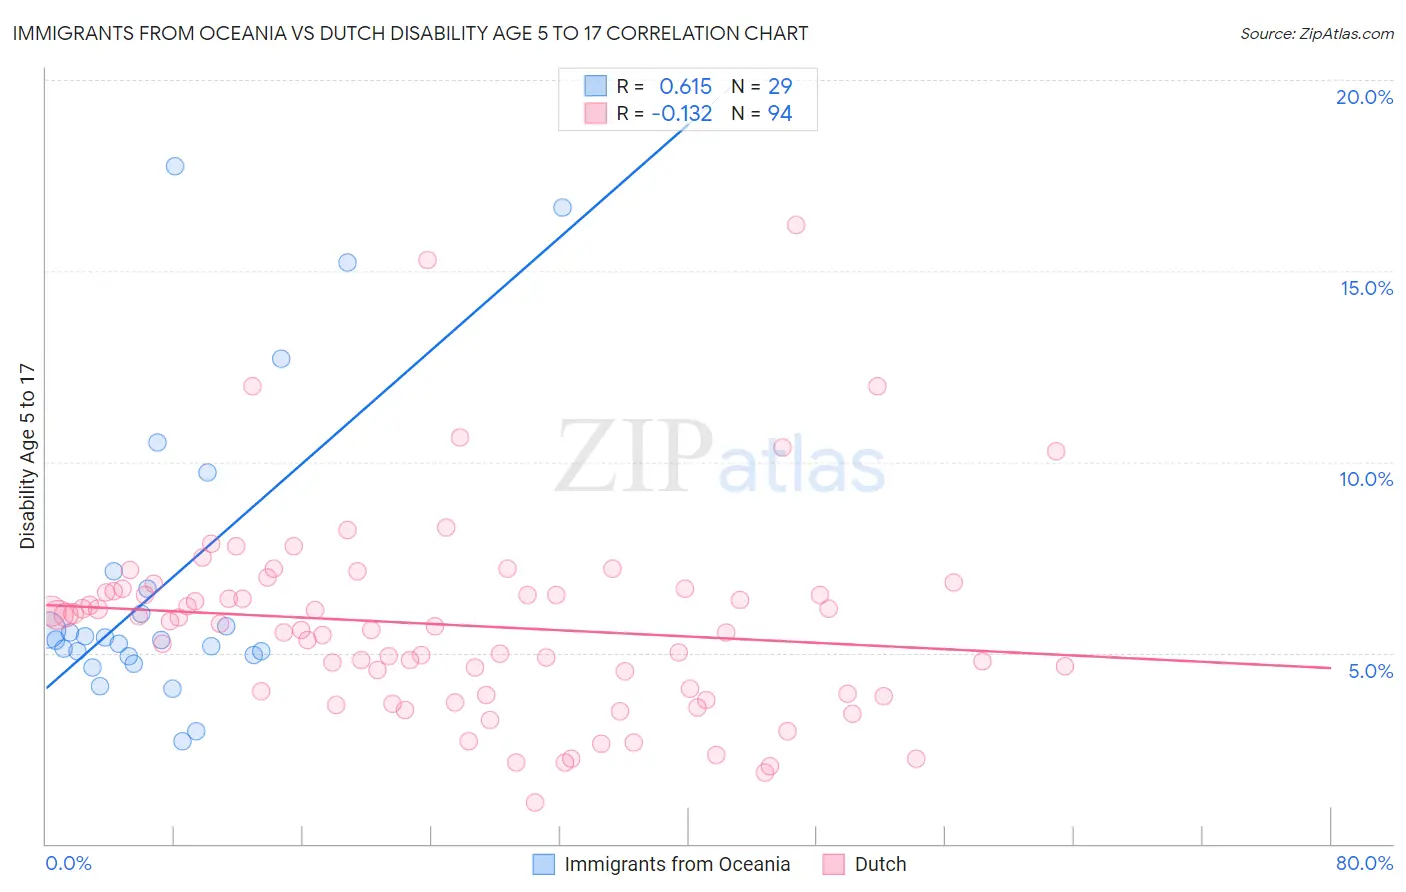
Immigrants from Oceania vs Dutch Disability Age 5 to 17 Correlation Chart
The statistical analysis conducted on geographies consisting of 303,486,257 people shows a significant positive correlation between the proportion of Immigrants from Oceania and percentage of population with a disability between the ages 5 and 17 in the United States with a correlation coefficient (R) of 0.615 and weighted average of 5.4%. Similarly, the statistical analysis conducted on geographies consisting of 542,324,990 people shows a poor negative correlation between the proportion of Dutch and percentage of population with a disability between the ages 5 and 17 in the United States with a correlation coefficient (R) of -0.132 and weighted average of 6.0%, a difference of 11.1%.
Disability Age 5 to 17 Correlation Summary
| Measurement | Immigrants from Oceania | Dutch |
| Minimum | 2.7% | 1.1% |
| Maximum | 17.7% | 16.2% |
| Range | 15.1% | 15.1% |
| Mean | 6.9% | 5.7% |
| Median | 5.3% | 5.7% |
| Interquartile 25% (IQ1) | 4.9% | 3.9% |
| Interquartile 75% (IQ3) | 6.9% | 6.6% |
| Interquartile Range (IQR) | 2.0% | 2.7% |
| Standard Deviation (Sample) | 3.9% | 2.6% |
| Standard Deviation (Population) | 3.9% | 2.6% |
Similar Demographics by Disability Age 5 to 17
Demographics Similar to Immigrants from Oceania by Disability Age 5 to 17
In terms of disability age 5 to 17, the demographic groups most similar to Immigrants from Oceania are Navajo (5.4%, a difference of 0.0%), Belizean (5.4%, a difference of 0.0%), Immigrants from Netherlands (5.4%, a difference of 0.050%), Immigrants from Denmark (5.4%, a difference of 0.090%), and Immigrants from Belize (5.4%, a difference of 0.14%).
| Demographics | Rating | Rank | Disability Age 5 to 17 |
| Arabs | 92.9 /100 | #131 | Exceptional 5.4% |
| Immigrants | Colombia | 92.9 /100 | #132 | Exceptional 5.4% |
| Venezuelans | 92.7 /100 | #133 | Exceptional 5.4% |
| Yuman | 92.3 /100 | #134 | Exceptional 5.4% |
| Immigrants | Belize | 91.7 /100 | #135 | Exceptional 5.4% |
| Immigrants | Denmark | 91.4 /100 | #136 | Exceptional 5.4% |
| Navajo | 90.9 /100 | #137 | Exceptional 5.4% |
| Immigrants | Oceania | 90.8 /100 | #138 | Exceptional 5.4% |
| Belizeans | 90.8 /100 | #139 | Exceptional 5.4% |
| Immigrants | Netherlands | 90.5 /100 | #140 | Exceptional 5.4% |
| South American Indians | 89.3 /100 | #141 | Excellent 5.5% |
| Colombians | 88.0 /100 | #142 | Excellent 5.5% |
| Immigrants | Hungary | 87.9 /100 | #143 | Excellent 5.5% |
| Pakistanis | 87.3 /100 | #144 | Excellent 5.5% |
| Immigrants | Guatemala | 86.6 /100 | #145 | Excellent 5.5% |
Demographics Similar to Dutch by Disability Age 5 to 17
In terms of disability age 5 to 17, the demographic groups most similar to Dutch are Cheyenne (6.0%, a difference of 0.11%), Japanese (6.1%, a difference of 0.11%), Alaska Native (6.0%, a difference of 0.22%), Finnish (6.0%, a difference of 0.27%), and Immigrants from Zaire (6.0%, a difference of 0.30%).
| Demographics | Rating | Rank | Disability Age 5 to 17 |
| Sioux | 0.4 /100 | #268 | Tragic 6.0% |
| Liberians | 0.4 /100 | #269 | Tragic 6.0% |
| Immigrants | Somalia | 0.4 /100 | #270 | Tragic 6.0% |
| Immigrants | Zaire | 0.2 /100 | #271 | Tragic 6.0% |
| Finns | 0.2 /100 | #272 | Tragic 6.0% |
| Alaska Natives | 0.2 /100 | #273 | Tragic 6.0% |
| Cheyenne | 0.2 /100 | #274 | Tragic 6.0% |
| Dutch | 0.2 /100 | #275 | Tragic 6.0% |
| Japanese | 0.1 /100 | #276 | Tragic 6.1% |
| Puget Sound Salish | 0.1 /100 | #277 | Tragic 6.1% |
| Immigrants | Liberia | 0.1 /100 | #278 | Tragic 6.1% |
| Immigrants | Jamaica | 0.1 /100 | #279 | Tragic 6.1% |
| Portuguese | 0.1 /100 | #280 | Tragic 6.1% |
| Scottish | 0.0 /100 | #281 | Tragic 6.1% |
| Germans | 0.0 /100 | #282 | Tragic 6.1% |