Immigrants from Argentina vs Dutch Disability Age 5 to 17
COMPARE
Immigrants from Argentina
Dutch
Disability Age 5 to 17
Disability Age 5 to 17 Comparison
Immigrants from Argentina
Dutch
5.0%
DISABILITY AGE 5 TO 17
100.0/ 100
METRIC RATING
39th/ 347
METRIC RANK
6.0%
DISABILITY AGE 5 TO 17
0.2/ 100
METRIC RATING
275th/ 347
METRIC RANK
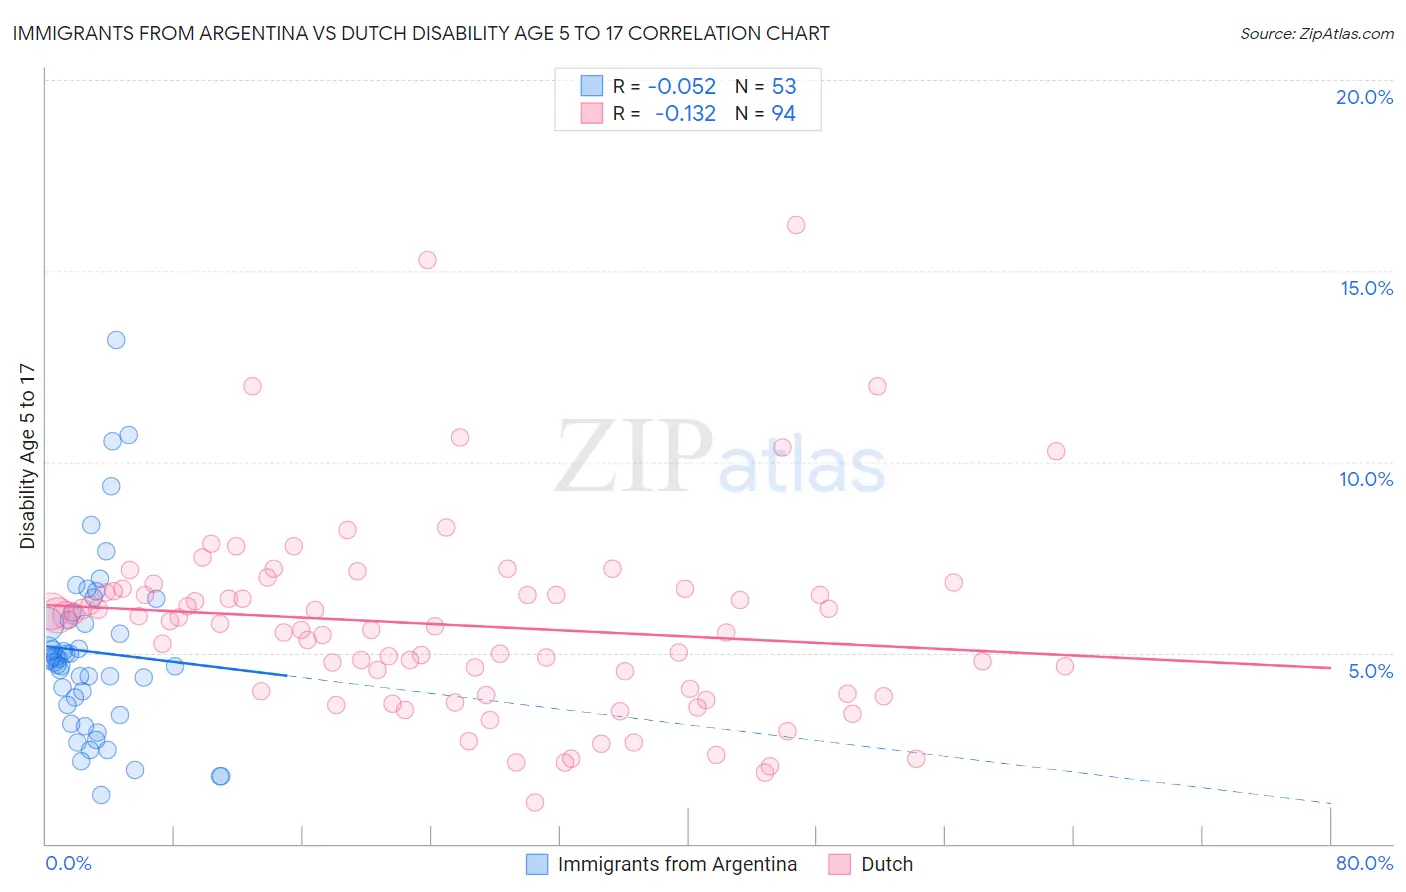
Immigrants from Argentina vs Dutch Disability Age 5 to 17 Correlation Chart
The statistical analysis conducted on geographies consisting of 262,882,826 people shows a slight negative correlation between the proportion of Immigrants from Argentina and percentage of population with a disability between the ages 5 and 17 in the United States with a correlation coefficient (R) of -0.052 and weighted average of 5.0%. Similarly, the statistical analysis conducted on geographies consisting of 542,324,990 people shows a poor negative correlation between the proportion of Dutch and percentage of population with a disability between the ages 5 and 17 in the United States with a correlation coefficient (R) of -0.132 and weighted average of 6.0%, a difference of 20.7%.
Disability Age 5 to 17 Correlation Summary
| Measurement | Immigrants from Argentina | Dutch |
| Minimum | 1.3% | 1.1% |
| Maximum | 13.2% | 16.2% |
| Range | 11.9% | 15.1% |
| Mean | 5.0% | 5.7% |
| Median | 4.8% | 5.7% |
| Interquartile 25% (IQ1) | 3.5% | 3.9% |
| Interquartile 75% (IQ3) | 6.0% | 6.6% |
| Interquartile Range (IQR) | 2.5% | 2.7% |
| Standard Deviation (Sample) | 2.3% | 2.6% |
| Standard Deviation (Population) | 2.3% | 2.6% |
Similar Demographics by Disability Age 5 to 17
Demographics Similar to Immigrants from Argentina by Disability Age 5 to 17
In terms of disability age 5 to 17, the demographic groups most similar to Immigrants from Argentina are Immigrants from Philippines (5.0%, a difference of 0.010%), Immigrants from Belarus (5.0%, a difference of 0.050%), Immigrants from Egypt (5.0%, a difference of 0.080%), Okinawan (5.0%, a difference of 0.080%), and Bolivian (5.0%, a difference of 0.12%).
| Demographics | Rating | Rank | Disability Age 5 to 17 |
| Soviet Union | 100.0 /100 | #32 | Exceptional 5.0% |
| Immigrants | Indonesia | 100.0 /100 | #33 | Exceptional 5.0% |
| Israelis | 100.0 /100 | #34 | Exceptional 5.0% |
| Bolivians | 100.0 /100 | #35 | Exceptional 5.0% |
| Immigrants | Egypt | 100.0 /100 | #36 | Exceptional 5.0% |
| Immigrants | Belarus | 100.0 /100 | #37 | Exceptional 5.0% |
| Immigrants | Philippines | 100.0 /100 | #38 | Exceptional 5.0% |
| Immigrants | Argentina | 100.0 /100 | #39 | Exceptional 5.0% |
| Okinawans | 100.0 /100 | #40 | Exceptional 5.0% |
| Immigrants | Australia | 100.0 /100 | #41 | Exceptional 5.0% |
| Immigrants | Sri Lanka | 100.0 /100 | #42 | Exceptional 5.0% |
| Immigrants | Russia | 100.0 /100 | #43 | Exceptional 5.0% |
| Egyptians | 100.0 /100 | #44 | Exceptional 5.0% |
| Tongans | 100.0 /100 | #45 | Exceptional 5.0% |
| Assyrians/Chaldeans/Syriacs | 100.0 /100 | #46 | Exceptional 5.0% |
Demographics Similar to Dutch by Disability Age 5 to 17
In terms of disability age 5 to 17, the demographic groups most similar to Dutch are Cheyenne (6.0%, a difference of 0.11%), Japanese (6.1%, a difference of 0.11%), Alaska Native (6.0%, a difference of 0.22%), Finnish (6.0%, a difference of 0.27%), and Immigrants from Zaire (6.0%, a difference of 0.30%).
| Demographics | Rating | Rank | Disability Age 5 to 17 |
| Sioux | 0.4 /100 | #268 | Tragic 6.0% |
| Liberians | 0.4 /100 | #269 | Tragic 6.0% |
| Immigrants | Somalia | 0.4 /100 | #270 | Tragic 6.0% |
| Immigrants | Zaire | 0.2 /100 | #271 | Tragic 6.0% |
| Finns | 0.2 /100 | #272 | Tragic 6.0% |
| Alaska Natives | 0.2 /100 | #273 | Tragic 6.0% |
| Cheyenne | 0.2 /100 | #274 | Tragic 6.0% |
| Dutch | 0.2 /100 | #275 | Tragic 6.0% |
| Japanese | 0.1 /100 | #276 | Tragic 6.1% |
| Puget Sound Salish | 0.1 /100 | #277 | Tragic 6.1% |
| Immigrants | Liberia | 0.1 /100 | #278 | Tragic 6.1% |
| Immigrants | Jamaica | 0.1 /100 | #279 | Tragic 6.1% |
| Portuguese | 0.1 /100 | #280 | Tragic 6.1% |
| Scottish | 0.0 /100 | #281 | Tragic 6.1% |
| Germans | 0.0 /100 | #282 | Tragic 6.1% |