Uruguayan vs Immigrants from Iran Ambulatory Disability
COMPARE
Uruguayan
Immigrants from Iran
Ambulatory Disability
Ambulatory Disability Comparison
Uruguayans
Immigrants from Iran
5.8%
AMBULATORY DISABILITY
97.2/ 100
METRIC RATING
107th/ 347
METRIC RANK
5.4%
AMBULATORY DISABILITY
100.0/ 100
METRIC RATING
29th/ 347
METRIC RANK
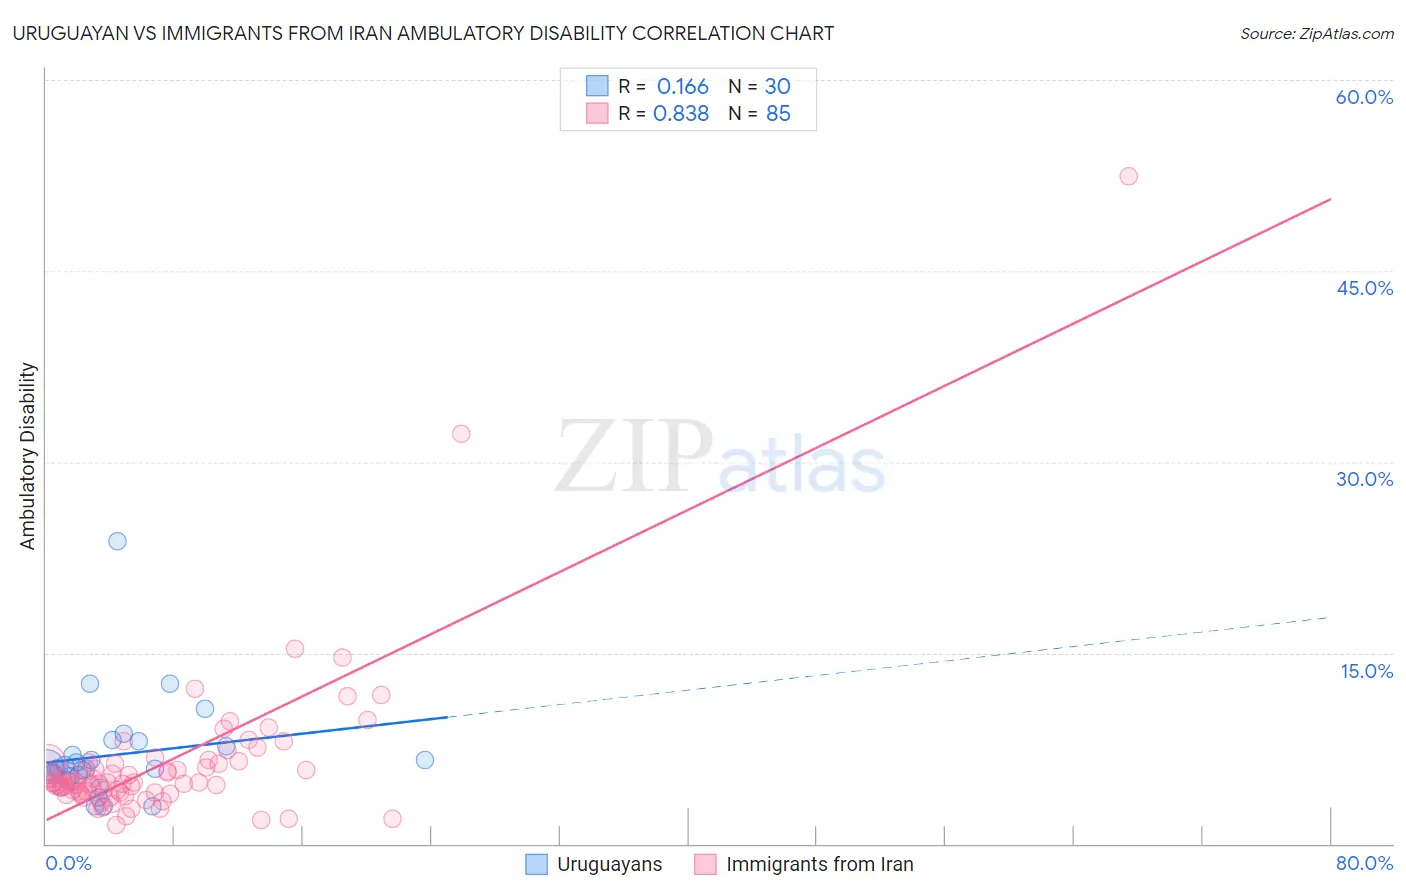
Uruguayan vs Immigrants from Iran Ambulatory Disability Correlation Chart
The statistical analysis conducted on geographies consisting of 144,780,979 people shows a poor positive correlation between the proportion of Uruguayans and percentage of population with ambulatory disability in the United States with a correlation coefficient (R) of 0.166 and weighted average of 5.8%. Similarly, the statistical analysis conducted on geographies consisting of 279,879,747 people shows a very strong positive correlation between the proportion of Immigrants from Iran and percentage of population with ambulatory disability in the United States with a correlation coefficient (R) of 0.838 and weighted average of 5.4%, a difference of 7.7%.
Ambulatory Disability Correlation Summary
| Measurement | Uruguayan | Immigrants from Iran |
| Minimum | 2.9% | 1.5% |
| Maximum | 23.8% | 52.5% |
| Range | 20.9% | 51.0% |
| Mean | 6.9% | 6.3% |
| Median | 5.9% | 4.8% |
| Interquartile 25% (IQ1) | 5.3% | 4.0% |
| Interquartile 75% (IQ3) | 7.7% | 6.3% |
| Interquartile Range (IQR) | 2.4% | 2.3% |
| Standard Deviation (Sample) | 4.0% | 6.4% |
| Standard Deviation (Population) | 3.9% | 6.3% |
Similar Demographics by Ambulatory Disability
Demographics Similar to Uruguayans by Ambulatory Disability
In terms of ambulatory disability, the demographic groups most similar to Uruguayans are Colombian (5.8%, a difference of 0.010%), Immigrants from Netherlands (5.8%, a difference of 0.030%), Immigrants from Morocco (5.8%, a difference of 0.050%), Immigrants from Czechoslovakia (5.8%, a difference of 0.12%), and Immigrants from Colombia (5.8%, a difference of 0.21%).
| Demographics | Rating | Rank | Ambulatory Disability |
| Immigrants | Serbia | 97.9 /100 | #100 | Exceptional 5.8% |
| Immigrants | South America | 97.9 /100 | #101 | Exceptional 5.8% |
| Immigrants | Kenya | 97.8 /100 | #102 | Exceptional 5.8% |
| Immigrants | Romania | 97.7 /100 | #103 | Exceptional 5.8% |
| New Zealanders | 97.6 /100 | #104 | Exceptional 5.8% |
| Immigrants | Czechoslovakia | 97.4 /100 | #105 | Exceptional 5.8% |
| Immigrants | Morocco | 97.3 /100 | #106 | Exceptional 5.8% |
| Uruguayans | 97.2 /100 | #107 | Exceptional 5.8% |
| Colombians | 97.2 /100 | #108 | Exceptional 5.8% |
| Immigrants | Netherlands | 97.1 /100 | #109 | Exceptional 5.8% |
| Immigrants | Colombia | 96.7 /100 | #110 | Exceptional 5.8% |
| Danes | 96.6 /100 | #111 | Exceptional 5.8% |
| South Africans | 96.3 /100 | #112 | Exceptional 5.9% |
| Immigrants | Uruguay | 95.6 /100 | #113 | Exceptional 5.9% |
| Immigrants | Poland | 95.4 /100 | #114 | Exceptional 5.9% |
Demographics Similar to Immigrants from Iran by Ambulatory Disability
In terms of ambulatory disability, the demographic groups most similar to Immigrants from Iran are Cambodian (5.4%, a difference of 0.10%), Asian (5.4%, a difference of 0.16%), Immigrants from Nepal (5.4%, a difference of 0.32%), Zimbabwean (5.4%, a difference of 0.35%), and Immigrants from Saudi Arabia (5.4%, a difference of 0.43%).
| Demographics | Rating | Rank | Ambulatory Disability |
| Immigrants | Israel | 100.0 /100 | #22 | Exceptional 5.4% |
| Tongans | 100.0 /100 | #23 | Exceptional 5.4% |
| Immigrants | Saudi Arabia | 100.0 /100 | #24 | Exceptional 5.4% |
| Zimbabweans | 100.0 /100 | #25 | Exceptional 5.4% |
| Immigrants | Nepal | 100.0 /100 | #26 | Exceptional 5.4% |
| Asians | 100.0 /100 | #27 | Exceptional 5.4% |
| Cambodians | 100.0 /100 | #28 | Exceptional 5.4% |
| Immigrants | Iran | 100.0 /100 | #29 | Exceptional 5.4% |
| Immigrants | Turkey | 100.0 /100 | #30 | Exceptional 5.4% |
| Immigrants | Venezuela | 100.0 /100 | #31 | Exceptional 5.4% |
| Immigrants | Australia | 100.0 /100 | #32 | Exceptional 5.5% |
| Immigrants | Pakistan | 100.0 /100 | #33 | Exceptional 5.5% |
| Immigrants | Asia | 100.0 /100 | #34 | Exceptional 5.5% |
| Afghans | 100.0 /100 | #35 | Exceptional 5.5% |
| Immigrants | Malaysia | 100.0 /100 | #36 | Exceptional 5.5% |