Israeli vs Immigrants from Iran Ambulatory Disability
COMPARE
Israeli
Immigrants from Iran
Ambulatory Disability
Ambulatory Disability Comparison
Israelis
Immigrants from Iran
5.7%
AMBULATORY DISABILITY
99.6/ 100
METRIC RATING
66th/ 347
METRIC RANK
5.4%
AMBULATORY DISABILITY
100.0/ 100
METRIC RATING
29th/ 347
METRIC RANK
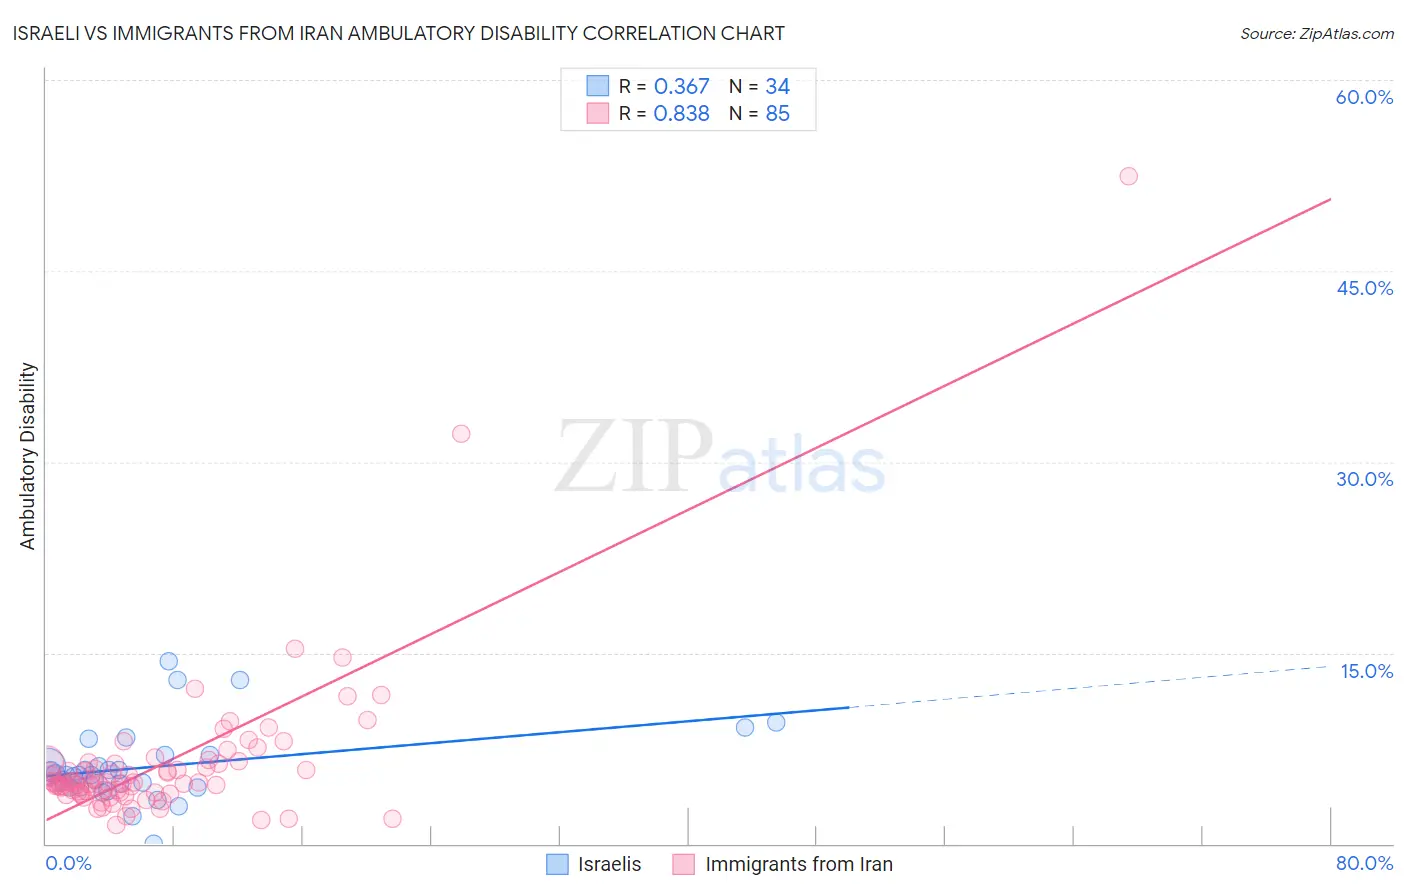
Israeli vs Immigrants from Iran Ambulatory Disability Correlation Chart
The statistical analysis conducted on geographies consisting of 211,116,012 people shows a mild positive correlation between the proportion of Israelis and percentage of population with ambulatory disability in the United States with a correlation coefficient (R) of 0.367 and weighted average of 5.7%. Similarly, the statistical analysis conducted on geographies consisting of 279,879,747 people shows a very strong positive correlation between the proportion of Immigrants from Iran and percentage of population with ambulatory disability in the United States with a correlation coefficient (R) of 0.838 and weighted average of 5.4%, a difference of 4.6%.
Ambulatory Disability Correlation Summary
| Measurement | Israeli | Immigrants from Iran |
| Minimum | 0.023% | 1.5% |
| Maximum | 14.3% | 52.5% |
| Range | 14.3% | 51.0% |
| Mean | 6.0% | 6.3% |
| Median | 5.4% | 4.8% |
| Interquartile 25% (IQ1) | 4.4% | 4.0% |
| Interquartile 75% (IQ3) | 6.9% | 6.3% |
| Interquartile Range (IQR) | 2.5% | 2.3% |
| Standard Deviation (Sample) | 3.0% | 6.4% |
| Standard Deviation (Population) | 2.9% | 6.3% |
Similar Demographics by Ambulatory Disability
Demographics Similar to Israelis by Ambulatory Disability
In terms of ambulatory disability, the demographic groups most similar to Israelis are Immigrants from Uganda (5.7%, a difference of 0.010%), Sri Lankan (5.7%, a difference of 0.040%), Immigrants from Switzerland (5.7%, a difference of 0.090%), Laotian (5.7%, a difference of 0.12%), and Immigrants from France (5.6%, a difference of 0.25%).
| Demographics | Rating | Rank | Ambulatory Disability |
| Immigrants | Afghanistan | 99.8 /100 | #59 | Exceptional 5.6% |
| Immigrants | Lithuania | 99.8 /100 | #60 | Exceptional 5.6% |
| Immigrants | Belgium | 99.7 /100 | #61 | Exceptional 5.6% |
| Immigrants | Spain | 99.7 /100 | #62 | Exceptional 5.6% |
| Immigrants | France | 99.7 /100 | #63 | Exceptional 5.6% |
| Laotians | 99.7 /100 | #64 | Exceptional 5.7% |
| Immigrants | Switzerland | 99.7 /100 | #65 | Exceptional 5.7% |
| Israelis | 99.6 /100 | #66 | Exceptional 5.7% |
| Immigrants | Uganda | 99.6 /100 | #67 | Exceptional 5.7% |
| Sri Lankans | 99.6 /100 | #68 | Exceptional 5.7% |
| Peruvians | 99.5 /100 | #69 | Exceptional 5.7% |
| Sierra Leoneans | 99.4 /100 | #70 | Exceptional 5.7% |
| Immigrants | Peru | 99.4 /100 | #71 | Exceptional 5.7% |
| Brazilians | 99.4 /100 | #72 | Exceptional 5.7% |
| Immigrants | Northern Africa | 99.4 /100 | #73 | Exceptional 5.7% |
Demographics Similar to Immigrants from Iran by Ambulatory Disability
In terms of ambulatory disability, the demographic groups most similar to Immigrants from Iran are Cambodian (5.4%, a difference of 0.10%), Asian (5.4%, a difference of 0.16%), Immigrants from Nepal (5.4%, a difference of 0.32%), Zimbabwean (5.4%, a difference of 0.35%), and Immigrants from Saudi Arabia (5.4%, a difference of 0.43%).
| Demographics | Rating | Rank | Ambulatory Disability |
| Immigrants | Israel | 100.0 /100 | #22 | Exceptional 5.4% |
| Tongans | 100.0 /100 | #23 | Exceptional 5.4% |
| Immigrants | Saudi Arabia | 100.0 /100 | #24 | Exceptional 5.4% |
| Zimbabweans | 100.0 /100 | #25 | Exceptional 5.4% |
| Immigrants | Nepal | 100.0 /100 | #26 | Exceptional 5.4% |
| Asians | 100.0 /100 | #27 | Exceptional 5.4% |
| Cambodians | 100.0 /100 | #28 | Exceptional 5.4% |
| Immigrants | Iran | 100.0 /100 | #29 | Exceptional 5.4% |
| Immigrants | Turkey | 100.0 /100 | #30 | Exceptional 5.4% |
| Immigrants | Venezuela | 100.0 /100 | #31 | Exceptional 5.4% |
| Immigrants | Australia | 100.0 /100 | #32 | Exceptional 5.5% |
| Immigrants | Pakistan | 100.0 /100 | #33 | Exceptional 5.5% |
| Immigrants | Asia | 100.0 /100 | #34 | Exceptional 5.5% |
| Afghans | 100.0 /100 | #35 | Exceptional 5.5% |
| Immigrants | Malaysia | 100.0 /100 | #36 | Exceptional 5.5% |