Immigrants from Ghana vs Uruguayan Male Disability
COMPARE
Immigrants from Ghana
Uruguayan
Male Disability
Male Disability Comparison
Immigrants from Ghana
Uruguayans
10.9%
MALE DISABILITY
89.0/ 100
METRIC RATING
122nd/ 347
METRIC RANK
10.7%
MALE DISABILITY
95.3/ 100
METRIC RATING
103rd/ 347
METRIC RANK
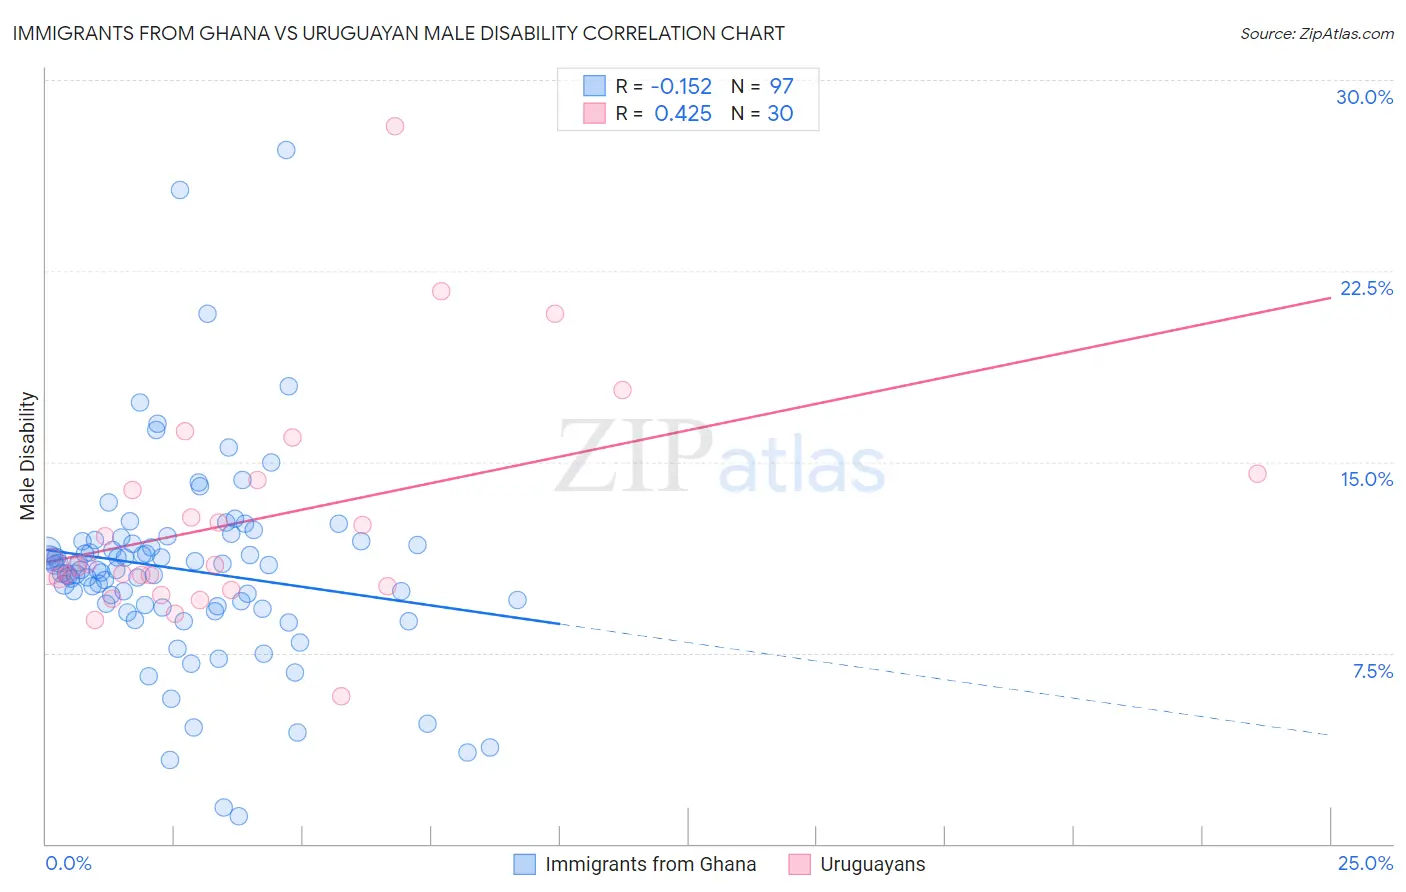
Immigrants from Ghana vs Uruguayan Male Disability Correlation Chart
The statistical analysis conducted on geographies consisting of 199,919,905 people shows a poor negative correlation between the proportion of Immigrants from Ghana and percentage of males with a disability in the United States with a correlation coefficient (R) of -0.152 and weighted average of 10.9%. Similarly, the statistical analysis conducted on geographies consisting of 144,784,300 people shows a moderate positive correlation between the proportion of Uruguayans and percentage of males with a disability in the United States with a correlation coefficient (R) of 0.425 and weighted average of 10.7%, a difference of 1.3%.
Male Disability Correlation Summary
| Measurement | Immigrants from Ghana | Uruguayan |
| Minimum | 1.1% | 5.8% |
| Maximum | 27.2% | 28.2% |
| Range | 26.2% | 22.4% |
| Mean | 10.8% | 12.7% |
| Median | 10.8% | 10.9% |
| Interquartile 25% (IQ1) | 9.3% | 10.1% |
| Interquartile 75% (IQ3) | 11.9% | 14.3% |
| Interquartile Range (IQR) | 2.6% | 4.2% |
| Standard Deviation (Sample) | 3.9% | 4.5% |
| Standard Deviation (Population) | 3.9% | 4.5% |
Demographics Similar to Immigrants from Ghana and Uruguayans by Male Disability
In terms of male disability, the demographic groups most similar to Immigrants from Ghana are Immigrants from South Eastern Asia (10.9%, a difference of 0.010%), Immigrants from Africa (10.9%, a difference of 0.060%), Immigrants from Cuba (10.9%, a difference of 0.17%), Armenian (10.9%, a difference of 0.17%), and Eastern European (10.9%, a difference of 0.25%). Similarly, the demographic groups most similar to Uruguayans are Immigrants from Eastern Europe (10.7%, a difference of 0.010%), Immigrants from Nigeria (10.8%, a difference of 0.060%), Immigrants from Brazil (10.8%, a difference of 0.080%), Immigrants from Syria (10.8%, a difference of 0.12%), and Immigrants from Eastern Africa (10.8%, a difference of 0.30%).
| Demographics | Rating | Rank | Male Disability |
| Immigrants | Eastern Europe | 95.3 /100 | #102 | Exceptional 10.7% |
| Uruguayans | 95.3 /100 | #103 | Exceptional 10.7% |
| Immigrants | Nigeria | 95.1 /100 | #104 | Exceptional 10.8% |
| Immigrants | Brazil | 95.0 /100 | #105 | Exceptional 10.8% |
| Immigrants | Syria | 94.9 /100 | #106 | Exceptional 10.8% |
| Immigrants | Eastern Africa | 94.3 /100 | #107 | Exceptional 10.8% |
| Immigrants | Belgium | 94.2 /100 | #108 | Exceptional 10.8% |
| Immigrants | Uganda | 94.0 /100 | #109 | Exceptional 10.8% |
| Immigrants | Immigrants | 93.9 /100 | #110 | Exceptional 10.8% |
| Immigrants | Uruguay | 93.8 /100 | #111 | Exceptional 10.8% |
| Ghanaians | 93.4 /100 | #112 | Exceptional 10.8% |
| Immigrants | Zimbabwe | 93.0 /100 | #113 | Exceptional 10.8% |
| Central Americans | 92.7 /100 | #114 | Exceptional 10.8% |
| Immigrants | Barbados | 92.2 /100 | #115 | Exceptional 10.8% |
| Immigrants | South Africa | 91.8 /100 | #116 | Exceptional 10.8% |
| Eastern Europeans | 90.6 /100 | #117 | Exceptional 10.9% |
| Immigrants | Cuba | 90.2 /100 | #118 | Exceptional 10.9% |
| Armenians | 90.1 /100 | #119 | Exceptional 10.9% |
| Immigrants | Africa | 89.4 /100 | #120 | Excellent 10.9% |
| Immigrants | South Eastern Asia | 89.2 /100 | #121 | Excellent 10.9% |
| Immigrants | Ghana | 89.0 /100 | #122 | Excellent 10.9% |