Scandinavian vs Uruguayan Male Disability
COMPARE
Scandinavian
Uruguayan
Male Disability
Male Disability Comparison
Scandinavians
Uruguayans
12.3%
MALE DISABILITY
0.1/ 100
METRIC RATING
271st/ 347
METRIC RANK
10.7%
MALE DISABILITY
95.3/ 100
METRIC RATING
103rd/ 347
METRIC RANK
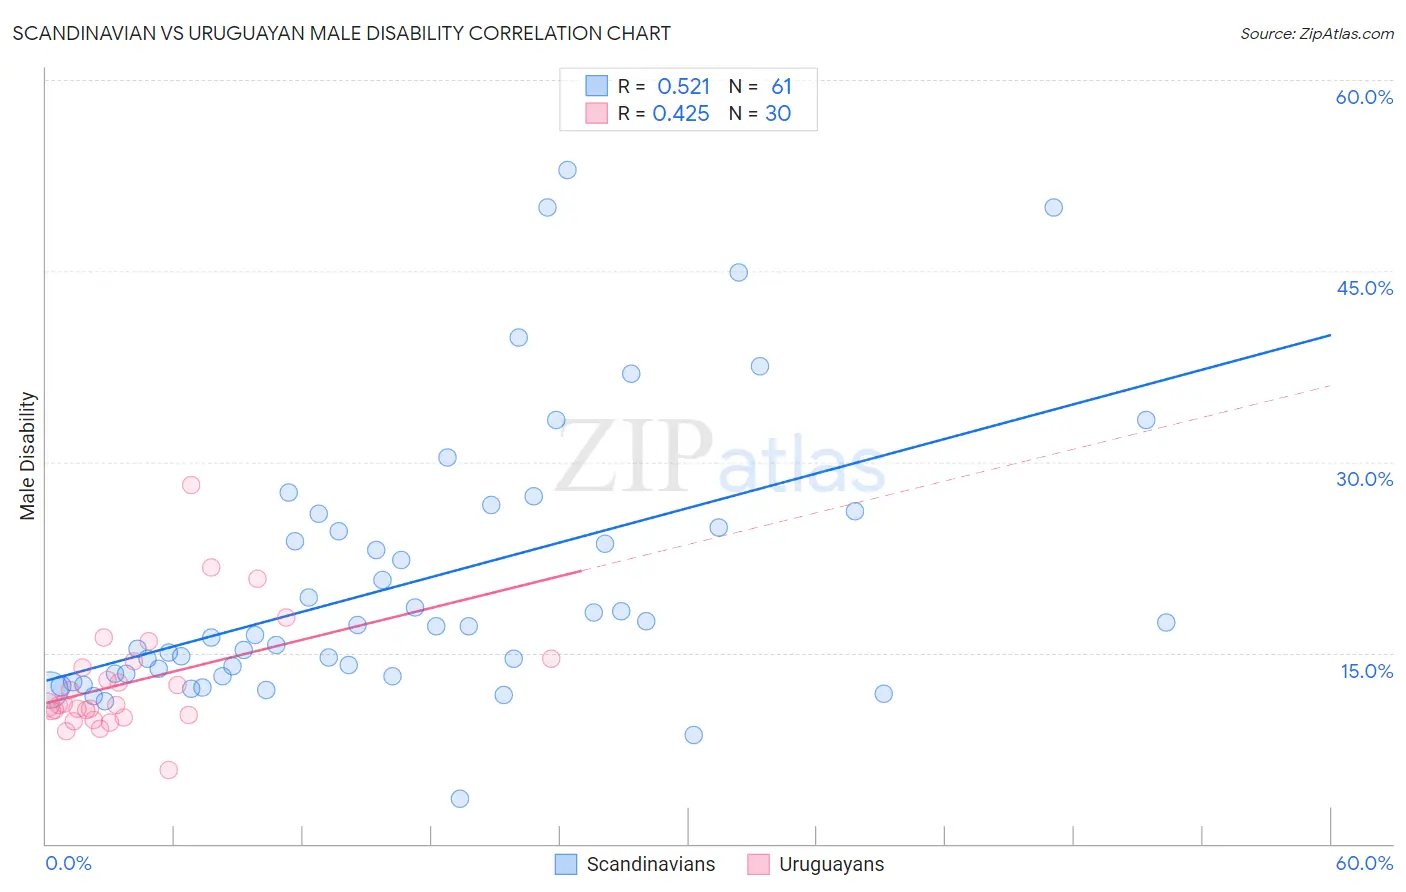
Scandinavian vs Uruguayan Male Disability Correlation Chart
The statistical analysis conducted on geographies consisting of 472,512,703 people shows a substantial positive correlation between the proportion of Scandinavians and percentage of males with a disability in the United States with a correlation coefficient (R) of 0.521 and weighted average of 12.3%. Similarly, the statistical analysis conducted on geographies consisting of 144,784,300 people shows a moderate positive correlation between the proportion of Uruguayans and percentage of males with a disability in the United States with a correlation coefficient (R) of 0.425 and weighted average of 10.7%, a difference of 14.6%.
Male Disability Correlation Summary
| Measurement | Scandinavian | Uruguayan |
| Minimum | 3.5% | 5.8% |
| Maximum | 52.9% | 28.2% |
| Range | 49.4% | 22.4% |
| Mean | 20.6% | 12.7% |
| Median | 17.0% | 10.9% |
| Interquartile 25% (IQ1) | 13.3% | 10.1% |
| Interquartile 75% (IQ3) | 25.4% | 14.3% |
| Interquartile Range (IQR) | 12.1% | 4.2% |
| Standard Deviation (Sample) | 10.7% | 4.5% |
| Standard Deviation (Population) | 10.7% | 4.5% |
Similar Demographics by Male Disability
Demographics Similar to Scandinavians by Male Disability
In terms of male disability, the demographic groups most similar to Scandinavians are Spaniard (12.3%, a difference of 0.19%), Portuguese (12.3%, a difference of 0.27%), Czechoslovakian (12.3%, a difference of 0.27%), Immigrants from Germany (12.3%, a difference of 0.40%), and Hawaiian (12.3%, a difference of 0.45%).
| Demographics | Rating | Rank | Male Disability |
| Nepalese | 0.2 /100 | #264 | Tragic 12.2% |
| Immigrants | Portugal | 0.1 /100 | #265 | Tragic 12.3% |
| Hawaiians | 0.1 /100 | #266 | Tragic 12.3% |
| Immigrants | Germany | 0.1 /100 | #267 | Tragic 12.3% |
| Portuguese | 0.1 /100 | #268 | Tragic 12.3% |
| Czechoslovakians | 0.1 /100 | #269 | Tragic 12.3% |
| Spaniards | 0.1 /100 | #270 | Tragic 12.3% |
| Scandinavians | 0.1 /100 | #271 | Tragic 12.3% |
| Hmong | 0.0 /100 | #272 | Tragic 12.5% |
| Native Hawaiians | 0.0 /100 | #273 | Tragic 12.5% |
| Hopi | 0.0 /100 | #274 | Tragic 12.5% |
| Fijians | 0.0 /100 | #275 | Tragic 12.6% |
| Africans | 0.0 /100 | #276 | Tragic 12.6% |
| Finns | 0.0 /100 | #277 | Tragic 12.6% |
| Central American Indians | 0.0 /100 | #278 | Tragic 12.7% |
Demographics Similar to Uruguayans by Male Disability
In terms of male disability, the demographic groups most similar to Uruguayans are Immigrants from Eastern Europe (10.7%, a difference of 0.010%), Immigrants from Nigeria (10.8%, a difference of 0.060%), Immigrants from Brazil (10.8%, a difference of 0.080%), Immigrants from Greece (10.7%, a difference of 0.11%), and Immigrants from Syria (10.8%, a difference of 0.12%).
| Demographics | Rating | Rank | Male Disability |
| Nicaraguans | 96.6 /100 | #96 | Exceptional 10.7% |
| Immigrants | Armenia | 96.6 /100 | #97 | Exceptional 10.7% |
| Immigrants | Romania | 96.5 /100 | #98 | Exceptional 10.7% |
| Immigrants | Switzerland | 96.1 /100 | #99 | Exceptional 10.7% |
| Immigrants | Kazakhstan | 95.9 /100 | #100 | Exceptional 10.7% |
| Immigrants | Greece | 95.6 /100 | #101 | Exceptional 10.7% |
| Immigrants | Eastern Europe | 95.3 /100 | #102 | Exceptional 10.7% |
| Uruguayans | 95.3 /100 | #103 | Exceptional 10.7% |
| Immigrants | Nigeria | 95.1 /100 | #104 | Exceptional 10.8% |
| Immigrants | Brazil | 95.0 /100 | #105 | Exceptional 10.8% |
| Immigrants | Syria | 94.9 /100 | #106 | Exceptional 10.8% |
| Immigrants | Eastern Africa | 94.3 /100 | #107 | Exceptional 10.8% |
| Immigrants | Belgium | 94.2 /100 | #108 | Exceptional 10.8% |
| Immigrants | Uganda | 94.0 /100 | #109 | Exceptional 10.8% |
| Immigrants | Immigrants | 93.9 /100 | #110 | Exceptional 10.8% |