Immigrants from Turkey vs Uruguayan Male Disability
COMPARE
Immigrants from Turkey
Uruguayan
Male Disability
Male Disability Comparison
Immigrants from Turkey
Uruguayans
10.2%
MALE DISABILITY
99.9/ 100
METRIC RATING
34th/ 347
METRIC RANK
10.7%
MALE DISABILITY
95.3/ 100
METRIC RATING
103rd/ 347
METRIC RANK
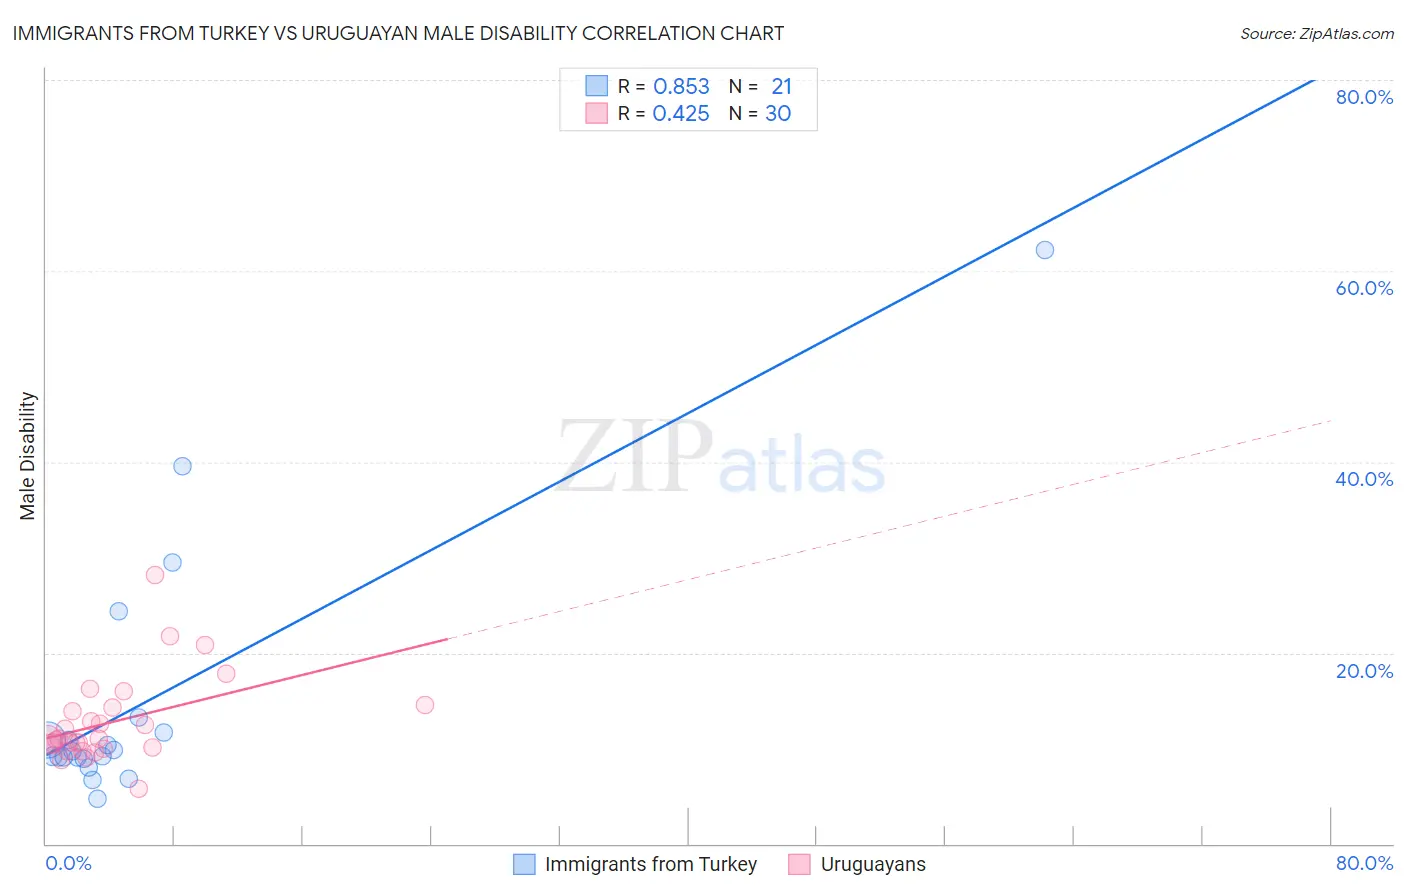
Immigrants from Turkey vs Uruguayan Male Disability Correlation Chart
The statistical analysis conducted on geographies consisting of 223,048,853 people shows a very strong positive correlation between the proportion of Immigrants from Turkey and percentage of males with a disability in the United States with a correlation coefficient (R) of 0.853 and weighted average of 10.2%. Similarly, the statistical analysis conducted on geographies consisting of 144,784,300 people shows a moderate positive correlation between the proportion of Uruguayans and percentage of males with a disability in the United States with a correlation coefficient (R) of 0.425 and weighted average of 10.7%, a difference of 5.5%.
Male Disability Correlation Summary
| Measurement | Immigrants from Turkey | Uruguayan |
| Minimum | 4.8% | 5.8% |
| Maximum | 62.2% | 28.2% |
| Range | 57.4% | 22.4% |
| Mean | 14.9% | 12.7% |
| Median | 9.7% | 10.9% |
| Interquartile 25% (IQ1) | 9.0% | 10.1% |
| Interquartile 75% (IQ3) | 12.5% | 14.3% |
| Interquartile Range (IQR) | 3.5% | 4.2% |
| Standard Deviation (Sample) | 13.7% | 4.5% |
| Standard Deviation (Population) | 13.4% | 4.5% |
Similar Demographics by Male Disability
Demographics Similar to Immigrants from Turkey by Male Disability
In terms of male disability, the demographic groups most similar to Immigrants from Turkey are Immigrants from Ethiopia (10.2%, a difference of 0.060%), Immigrants from Argentina (10.2%, a difference of 0.11%), Ethiopian (10.2%, a difference of 0.16%), Immigrants from Indonesia (10.2%, a difference of 0.24%), and Immigrants from Kuwait (10.2%, a difference of 0.41%).
| Demographics | Rating | Rank | Male Disability |
| Egyptians | 99.9 /100 | #27 | Exceptional 10.1% |
| Vietnamese | 99.9 /100 | #28 | Exceptional 10.1% |
| Venezuelans | 99.9 /100 | #29 | Exceptional 10.1% |
| Immigrants | Egypt | 99.9 /100 | #30 | Exceptional 10.1% |
| Soviet Union | 99.9 /100 | #31 | Exceptional 10.1% |
| Argentineans | 99.9 /100 | #32 | Exceptional 10.1% |
| Immigrants | Ethiopia | 99.9 /100 | #33 | Exceptional 10.2% |
| Immigrants | Turkey | 99.9 /100 | #34 | Exceptional 10.2% |
| Immigrants | Argentina | 99.9 /100 | #35 | Exceptional 10.2% |
| Ethiopians | 99.8 /100 | #36 | Exceptional 10.2% |
| Immigrants | Indonesia | 99.8 /100 | #37 | Exceptional 10.2% |
| Immigrants | Kuwait | 99.8 /100 | #38 | Exceptional 10.2% |
| Afghans | 99.8 /100 | #39 | Exceptional 10.2% |
| Immigrants | Nepal | 99.8 /100 | #40 | Exceptional 10.3% |
| Taiwanese | 99.8 /100 | #41 | Exceptional 10.3% |
Demographics Similar to Uruguayans by Male Disability
In terms of male disability, the demographic groups most similar to Uruguayans are Immigrants from Eastern Europe (10.7%, a difference of 0.010%), Immigrants from Nigeria (10.8%, a difference of 0.060%), Immigrants from Brazil (10.8%, a difference of 0.080%), Immigrants from Greece (10.7%, a difference of 0.11%), and Immigrants from Syria (10.8%, a difference of 0.12%).
| Demographics | Rating | Rank | Male Disability |
| Nicaraguans | 96.6 /100 | #96 | Exceptional 10.7% |
| Immigrants | Armenia | 96.6 /100 | #97 | Exceptional 10.7% |
| Immigrants | Romania | 96.5 /100 | #98 | Exceptional 10.7% |
| Immigrants | Switzerland | 96.1 /100 | #99 | Exceptional 10.7% |
| Immigrants | Kazakhstan | 95.9 /100 | #100 | Exceptional 10.7% |
| Immigrants | Greece | 95.6 /100 | #101 | Exceptional 10.7% |
| Immigrants | Eastern Europe | 95.3 /100 | #102 | Exceptional 10.7% |
| Uruguayans | 95.3 /100 | #103 | Exceptional 10.7% |
| Immigrants | Nigeria | 95.1 /100 | #104 | Exceptional 10.8% |
| Immigrants | Brazil | 95.0 /100 | #105 | Exceptional 10.8% |
| Immigrants | Syria | 94.9 /100 | #106 | Exceptional 10.8% |
| Immigrants | Eastern Africa | 94.3 /100 | #107 | Exceptional 10.8% |
| Immigrants | Belgium | 94.2 /100 | #108 | Exceptional 10.8% |
| Immigrants | Uganda | 94.0 /100 | #109 | Exceptional 10.8% |
| Immigrants | Immigrants | 93.9 /100 | #110 | Exceptional 10.8% |