Puget Sound Salish vs Bolivian Disability Age 5 to 17
COMPARE
Puget Sound Salish
Bolivian
Disability Age 5 to 17
Disability Age 5 to 17 Comparison
Puget Sound Salish
Bolivians
6.1%
DISABILITY AGE 5 TO 17
0.1/ 100
METRIC RATING
277th/ 347
METRIC RANK
5.0%
DISABILITY AGE 5 TO 17
100.0/ 100
METRIC RATING
35th/ 347
METRIC RANK
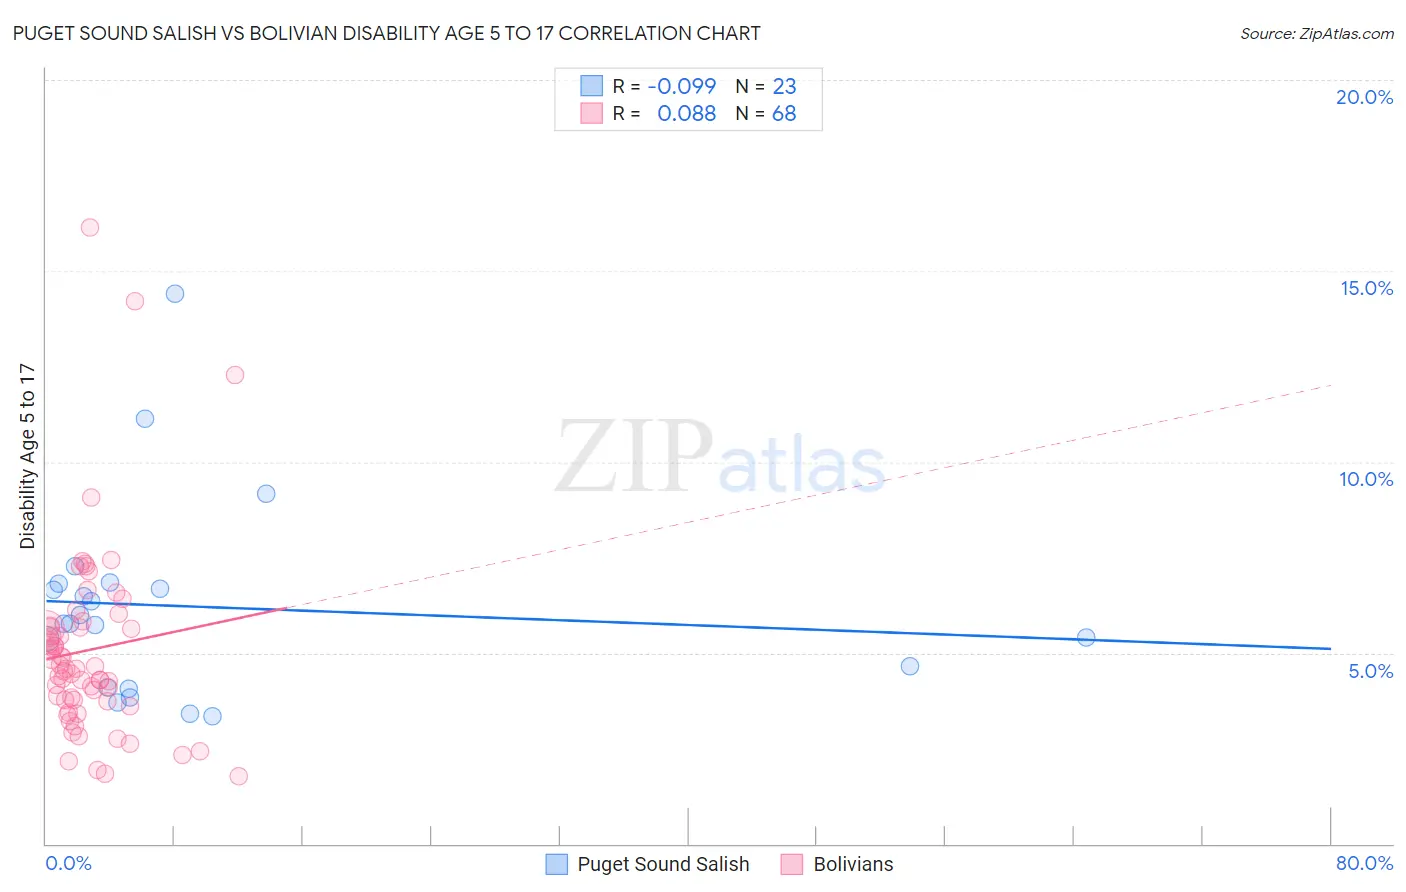
Puget Sound Salish vs Bolivian Disability Age 5 to 17 Correlation Chart
The statistical analysis conducted on geographies consisting of 46,037,254 people shows a slight negative correlation between the proportion of Puget Sound Salish and percentage of population with a disability between the ages 5 and 17 in the United States with a correlation coefficient (R) of -0.099 and weighted average of 6.1%. Similarly, the statistical analysis conducted on geographies consisting of 184,162,509 people shows a slight positive correlation between the proportion of Bolivians and percentage of population with a disability between the ages 5 and 17 in the United States with a correlation coefficient (R) of 0.088 and weighted average of 5.0%, a difference of 21.8%.
Disability Age 5 to 17 Correlation Summary
| Measurement | Puget Sound Salish | Bolivian |
| Minimum | 3.3% | 1.8% |
| Maximum | 14.4% | 16.1% |
| Range | 11.1% | 14.4% |
| Mean | 6.2% | 5.1% |
| Median | 5.8% | 4.6% |
| Interquartile 25% (IQ1) | 4.1% | 3.7% |
| Interquartile 75% (IQ3) | 6.8% | 5.7% |
| Interquartile Range (IQR) | 2.7% | 1.9% |
| Standard Deviation (Sample) | 2.6% | 2.5% |
| Standard Deviation (Population) | 2.5% | 2.5% |
Similar Demographics by Disability Age 5 to 17
Demographics Similar to Puget Sound Salish by Disability Age 5 to 17
In terms of disability age 5 to 17, the demographic groups most similar to Puget Sound Salish are Immigrants from Liberia (6.1%, a difference of 0.080%), Immigrants from Jamaica (6.1%, a difference of 0.22%), Portuguese (6.1%, a difference of 0.36%), Scottish (6.1%, a difference of 0.61%), and Japanese (6.1%, a difference of 0.72%).
| Demographics | Rating | Rank | Disability Age 5 to 17 |
| Immigrants | Somalia | 0.4 /100 | #270 | Tragic 6.0% |
| Immigrants | Zaire | 0.2 /100 | #271 | Tragic 6.0% |
| Finns | 0.2 /100 | #272 | Tragic 6.0% |
| Alaska Natives | 0.2 /100 | #273 | Tragic 6.0% |
| Cheyenne | 0.2 /100 | #274 | Tragic 6.0% |
| Dutch | 0.2 /100 | #275 | Tragic 6.0% |
| Japanese | 0.1 /100 | #276 | Tragic 6.1% |
| Puget Sound Salish | 0.1 /100 | #277 | Tragic 6.1% |
| Immigrants | Liberia | 0.1 /100 | #278 | Tragic 6.1% |
| Immigrants | Jamaica | 0.1 /100 | #279 | Tragic 6.1% |
| Portuguese | 0.1 /100 | #280 | Tragic 6.1% |
| Scottish | 0.0 /100 | #281 | Tragic 6.1% |
| Germans | 0.0 /100 | #282 | Tragic 6.1% |
| Ugandans | 0.0 /100 | #283 | Tragic 6.2% |
| Sub-Saharan Africans | 0.0 /100 | #284 | Tragic 6.2% |
Demographics Similar to Bolivians by Disability Age 5 to 17
In terms of disability age 5 to 17, the demographic groups most similar to Bolivians are Immigrants from Egypt (5.0%, a difference of 0.050%), Immigrants from Belarus (5.0%, a difference of 0.070%), Immigrants from Philippines (5.0%, a difference of 0.11%), Immigrants from Argentina (5.0%, a difference of 0.12%), and Israeli (5.0%, a difference of 0.19%).
| Demographics | Rating | Rank | Disability Age 5 to 17 |
| Immigrants | Japan | 100.0 /100 | #28 | Exceptional 4.9% |
| Immigrants | Serbia | 100.0 /100 | #29 | Exceptional 4.9% |
| Immigrants | Malaysia | 100.0 /100 | #30 | Exceptional 5.0% |
| Immigrants | Pakistan | 100.0 /100 | #31 | Exceptional 5.0% |
| Soviet Union | 100.0 /100 | #32 | Exceptional 5.0% |
| Immigrants | Indonesia | 100.0 /100 | #33 | Exceptional 5.0% |
| Israelis | 100.0 /100 | #34 | Exceptional 5.0% |
| Bolivians | 100.0 /100 | #35 | Exceptional 5.0% |
| Immigrants | Egypt | 100.0 /100 | #36 | Exceptional 5.0% |
| Immigrants | Belarus | 100.0 /100 | #37 | Exceptional 5.0% |
| Immigrants | Philippines | 100.0 /100 | #38 | Exceptional 5.0% |
| Immigrants | Argentina | 100.0 /100 | #39 | Exceptional 5.0% |
| Okinawans | 100.0 /100 | #40 | Exceptional 5.0% |
| Immigrants | Australia | 100.0 /100 | #41 | Exceptional 5.0% |
| Immigrants | Sri Lanka | 100.0 /100 | #42 | Exceptional 5.0% |