Puget Sound Salish vs Immigrants from South Central Asia Disability Age 5 to 17
COMPARE
Puget Sound Salish
Immigrants from South Central Asia
Disability Age 5 to 17
Disability Age 5 to 17 Comparison
Puget Sound Salish
Immigrants from South Central Asia
6.1%
DISABILITY AGE 5 TO 17
0.1/ 100
METRIC RATING
277th/ 347
METRIC RANK
4.7%
DISABILITY AGE 5 TO 17
100.0/ 100
METRIC RATING
18th/ 347
METRIC RANK
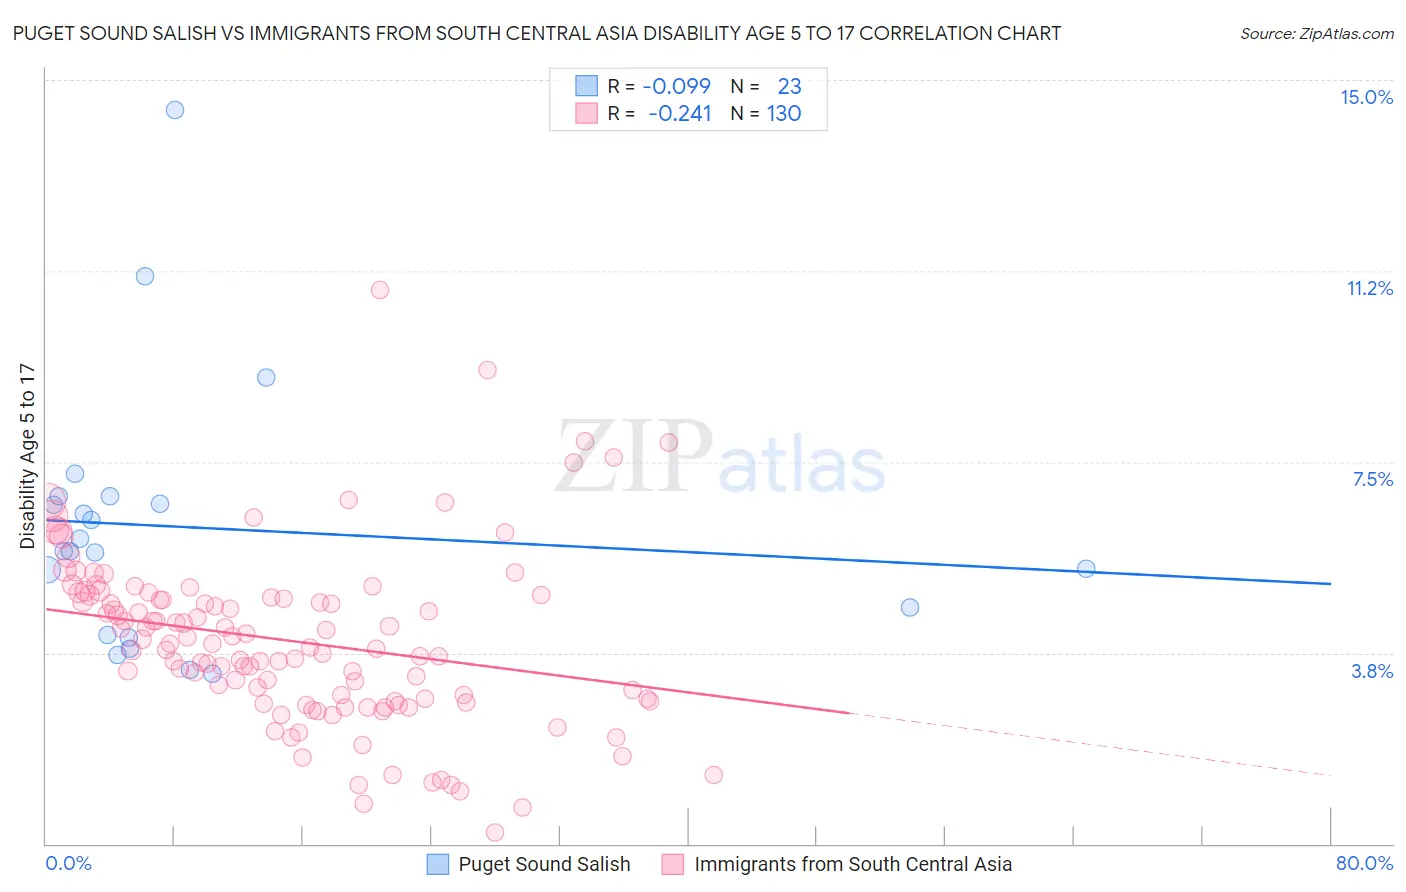
Puget Sound Salish vs Immigrants from South Central Asia Disability Age 5 to 17 Correlation Chart
The statistical analysis conducted on geographies consisting of 46,037,254 people shows a slight negative correlation between the proportion of Puget Sound Salish and percentage of population with a disability between the ages 5 and 17 in the United States with a correlation coefficient (R) of -0.099 and weighted average of 6.1%. Similarly, the statistical analysis conducted on geographies consisting of 467,856,625 people shows a weak negative correlation between the proportion of Immigrants from South Central Asia and percentage of population with a disability between the ages 5 and 17 in the United States with a correlation coefficient (R) of -0.241 and weighted average of 4.7%, a difference of 28.7%.
Disability Age 5 to 17 Correlation Summary
| Measurement | Puget Sound Salish | Immigrants from South Central Asia |
| Minimum | 3.3% | 0.21% |
| Maximum | 14.4% | 10.9% |
| Range | 11.1% | 10.7% |
| Mean | 6.2% | 4.0% |
| Median | 5.8% | 3.9% |
| Interquartile 25% (IQ1) | 4.1% | 2.8% |
| Interquartile 75% (IQ3) | 6.8% | 4.8% |
| Interquartile Range (IQR) | 2.7% | 2.0% |
| Standard Deviation (Sample) | 2.6% | 1.7% |
| Standard Deviation (Population) | 2.5% | 1.7% |
Similar Demographics by Disability Age 5 to 17
Demographics Similar to Puget Sound Salish by Disability Age 5 to 17
In terms of disability age 5 to 17, the demographic groups most similar to Puget Sound Salish are Immigrants from Liberia (6.1%, a difference of 0.080%), Immigrants from Jamaica (6.1%, a difference of 0.22%), Portuguese (6.1%, a difference of 0.36%), Scottish (6.1%, a difference of 0.61%), and Japanese (6.1%, a difference of 0.72%).
| Demographics | Rating | Rank | Disability Age 5 to 17 |
| Immigrants | Somalia | 0.4 /100 | #270 | Tragic 6.0% |
| Immigrants | Zaire | 0.2 /100 | #271 | Tragic 6.0% |
| Finns | 0.2 /100 | #272 | Tragic 6.0% |
| Alaska Natives | 0.2 /100 | #273 | Tragic 6.0% |
| Cheyenne | 0.2 /100 | #274 | Tragic 6.0% |
| Dutch | 0.2 /100 | #275 | Tragic 6.0% |
| Japanese | 0.1 /100 | #276 | Tragic 6.1% |
| Puget Sound Salish | 0.1 /100 | #277 | Tragic 6.1% |
| Immigrants | Liberia | 0.1 /100 | #278 | Tragic 6.1% |
| Immigrants | Jamaica | 0.1 /100 | #279 | Tragic 6.1% |
| Portuguese | 0.1 /100 | #280 | Tragic 6.1% |
| Scottish | 0.0 /100 | #281 | Tragic 6.1% |
| Germans | 0.0 /100 | #282 | Tragic 6.1% |
| Ugandans | 0.0 /100 | #283 | Tragic 6.2% |
| Sub-Saharan Africans | 0.0 /100 | #284 | Tragic 6.2% |
Demographics Similar to Immigrants from South Central Asia by Disability Age 5 to 17
In terms of disability age 5 to 17, the demographic groups most similar to Immigrants from South Central Asia are Arapaho (4.7%, a difference of 0.020%), Immigrants from Singapore (4.7%, a difference of 0.48%), Immigrants from Uzbekistan (4.8%, a difference of 0.49%), Burmese (4.8%, a difference of 0.87%), and Chinese (4.7%, a difference of 0.90%).
| Demographics | Rating | Rank | Disability Age 5 to 17 |
| Armenians | 100.0 /100 | #11 | Exceptional 4.6% |
| Iranians | 100.0 /100 | #12 | Exceptional 4.6% |
| Thais | 100.0 /100 | #13 | Exceptional 4.7% |
| Immigrants | Korea | 100.0 /100 | #14 | Exceptional 4.7% |
| Chinese | 100.0 /100 | #15 | Exceptional 4.7% |
| Immigrants | Singapore | 100.0 /100 | #16 | Exceptional 4.7% |
| Arapaho | 100.0 /100 | #17 | Exceptional 4.7% |
| Immigrants | South Central Asia | 100.0 /100 | #18 | Exceptional 4.7% |
| Immigrants | Uzbekistan | 100.0 /100 | #19 | Exceptional 4.8% |
| Burmese | 100.0 /100 | #20 | Exceptional 4.8% |
| Yup'ik | 100.0 /100 | #21 | Exceptional 4.8% |
| Asians | 100.0 /100 | #22 | Exceptional 4.8% |
| Immigrants | Bolivia | 100.0 /100 | #23 | Exceptional 4.8% |
| Immigrants | Lebanon | 100.0 /100 | #24 | Exceptional 4.8% |
| Immigrants | Asia | 100.0 /100 | #25 | Exceptional 4.8% |