Puget Sound Salish vs Spanish American Indian Disability Age 5 to 17
COMPARE
Puget Sound Salish
Spanish American Indian
Disability Age 5 to 17
Disability Age 5 to 17 Comparison
Puget Sound Salish
Spanish American Indians
6.1%
DISABILITY AGE 5 TO 17
0.1/ 100
METRIC RATING
277th/ 347
METRIC RANK
5.7%
DISABILITY AGE 5 TO 17
12.8/ 100
METRIC RATING
203rd/ 347
METRIC RANK
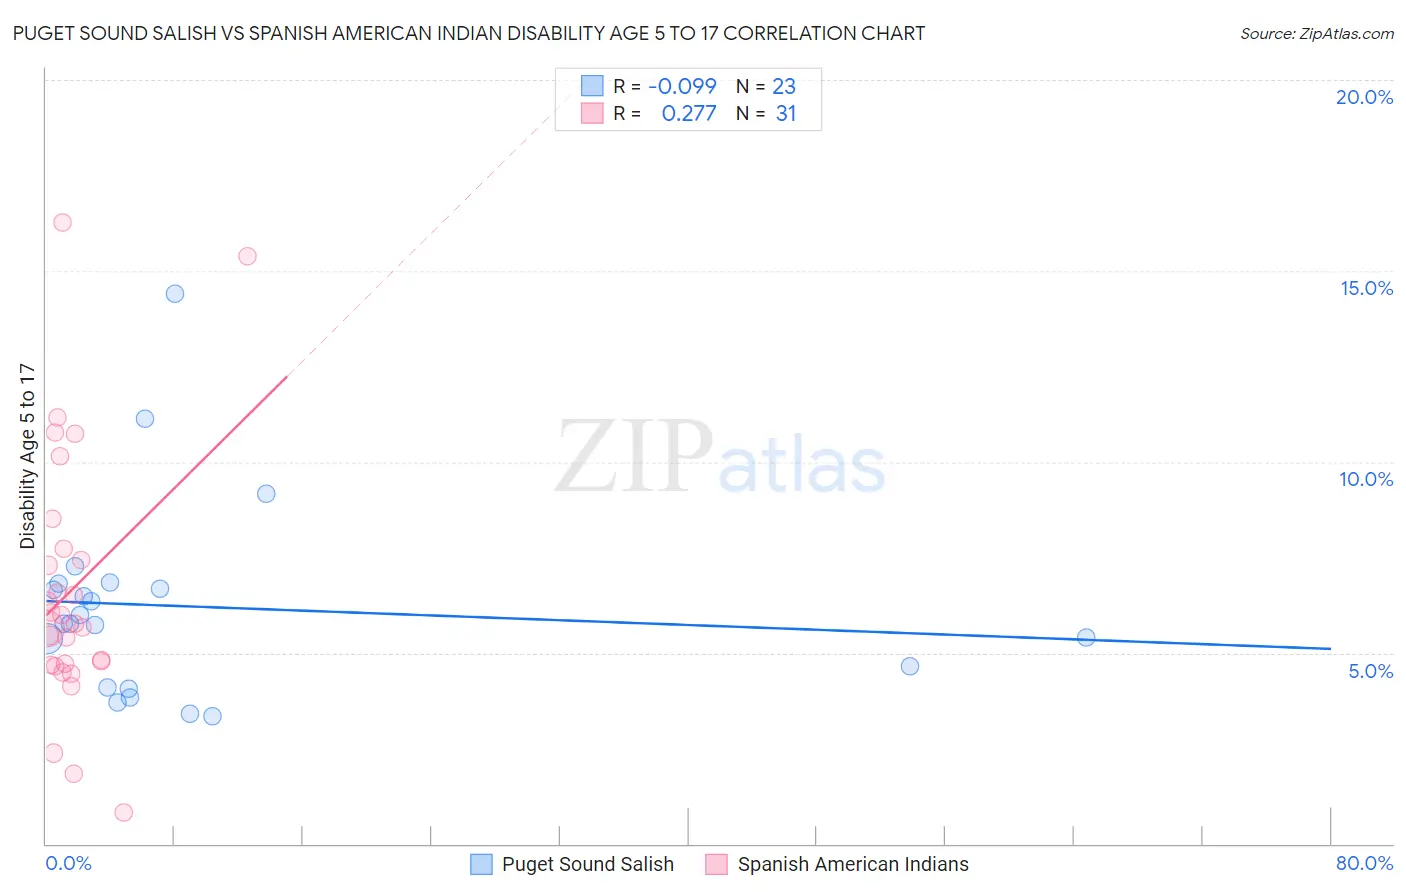
Puget Sound Salish vs Spanish American Indian Disability Age 5 to 17 Correlation Chart
The statistical analysis conducted on geographies consisting of 46,037,254 people shows a slight negative correlation between the proportion of Puget Sound Salish and percentage of population with a disability between the ages 5 and 17 in the United States with a correlation coefficient (R) of -0.099 and weighted average of 6.1%. Similarly, the statistical analysis conducted on geographies consisting of 73,116,155 people shows a weak positive correlation between the proportion of Spanish American Indians and percentage of population with a disability between the ages 5 and 17 in the United States with a correlation coefficient (R) of 0.277 and weighted average of 5.7%, a difference of 6.3%.
Disability Age 5 to 17 Correlation Summary
| Measurement | Puget Sound Salish | Spanish American Indian |
| Minimum | 3.3% | 0.82% |
| Maximum | 14.4% | 16.3% |
| Range | 11.1% | 15.4% |
| Mean | 6.2% | 6.7% |
| Median | 5.8% | 5.8% |
| Interquartile 25% (IQ1) | 4.1% | 4.7% |
| Interquartile 75% (IQ3) | 6.8% | 7.7% |
| Interquartile Range (IQR) | 2.7% | 3.0% |
| Standard Deviation (Sample) | 2.6% | 3.5% |
| Standard Deviation (Population) | 2.5% | 3.4% |
Similar Demographics by Disability Age 5 to 17
Demographics Similar to Puget Sound Salish by Disability Age 5 to 17
In terms of disability age 5 to 17, the demographic groups most similar to Puget Sound Salish are Immigrants from Liberia (6.1%, a difference of 0.080%), Immigrants from Jamaica (6.1%, a difference of 0.22%), Portuguese (6.1%, a difference of 0.36%), Scottish (6.1%, a difference of 0.61%), and Japanese (6.1%, a difference of 0.72%).
| Demographics | Rating | Rank | Disability Age 5 to 17 |
| Immigrants | Somalia | 0.4 /100 | #270 | Tragic 6.0% |
| Immigrants | Zaire | 0.2 /100 | #271 | Tragic 6.0% |
| Finns | 0.2 /100 | #272 | Tragic 6.0% |
| Alaska Natives | 0.2 /100 | #273 | Tragic 6.0% |
| Cheyenne | 0.2 /100 | #274 | Tragic 6.0% |
| Dutch | 0.2 /100 | #275 | Tragic 6.0% |
| Japanese | 0.1 /100 | #276 | Tragic 6.1% |
| Puget Sound Salish | 0.1 /100 | #277 | Tragic 6.1% |
| Immigrants | Liberia | 0.1 /100 | #278 | Tragic 6.1% |
| Immigrants | Jamaica | 0.1 /100 | #279 | Tragic 6.1% |
| Portuguese | 0.1 /100 | #280 | Tragic 6.1% |
| Scottish | 0.0 /100 | #281 | Tragic 6.1% |
| Germans | 0.0 /100 | #282 | Tragic 6.1% |
| Ugandans | 0.0 /100 | #283 | Tragic 6.2% |
| Sub-Saharan Africans | 0.0 /100 | #284 | Tragic 6.2% |
Demographics Similar to Spanish American Indians by Disability Age 5 to 17
In terms of disability age 5 to 17, the demographic groups most similar to Spanish American Indians are Austrian (5.7%, a difference of 0.040%), Basque (5.7%, a difference of 0.090%), Icelander (5.7%, a difference of 0.18%), Paiute (5.7%, a difference of 0.18%), and Trinidadian and Tobagonian (5.7%, a difference of 0.23%).
| Demographics | Rating | Rank | Disability Age 5 to 17 |
| Inupiat | 23.3 /100 | #196 | Fair 5.7% |
| Immigrants | North America | 23.1 /100 | #197 | Fair 5.7% |
| Norwegians | 20.9 /100 | #198 | Fair 5.7% |
| Northern Europeans | 15.2 /100 | #199 | Poor 5.7% |
| Icelanders | 14.6 /100 | #200 | Poor 5.7% |
| Basques | 13.7 /100 | #201 | Poor 5.7% |
| Austrians | 13.2 /100 | #202 | Poor 5.7% |
| Spanish American Indians | 12.8 /100 | #203 | Poor 5.7% |
| Paiute | 11.2 /100 | #204 | Poor 5.7% |
| Trinidadians and Tobagonians | 10.8 /100 | #205 | Poor 5.7% |
| Immigrants | Africa | 10.8 /100 | #206 | Poor 5.7% |
| Moroccans | 10.4 /100 | #207 | Poor 5.7% |
| Kenyans | 10.0 /100 | #208 | Poor 5.8% |
| Immigrants | Uganda | 9.7 /100 | #209 | Tragic 5.8% |
| Immigrants | Haiti | 9.5 /100 | #210 | Tragic 5.8% |