Puget Sound Salish vs Immigrants from Bosnia and Herzegovina Disability Age 5 to 17
COMPARE
Puget Sound Salish
Immigrants from Bosnia and Herzegovina
Disability Age 5 to 17
Disability Age 5 to 17 Comparison
Puget Sound Salish
Immigrants from Bosnia and Herzegovina
6.1%
DISABILITY AGE 5 TO 17
0.1/ 100
METRIC RATING
277th/ 347
METRIC RANK
5.7%
DISABILITY AGE 5 TO 17
26.3/ 100
METRIC RATING
192nd/ 347
METRIC RANK
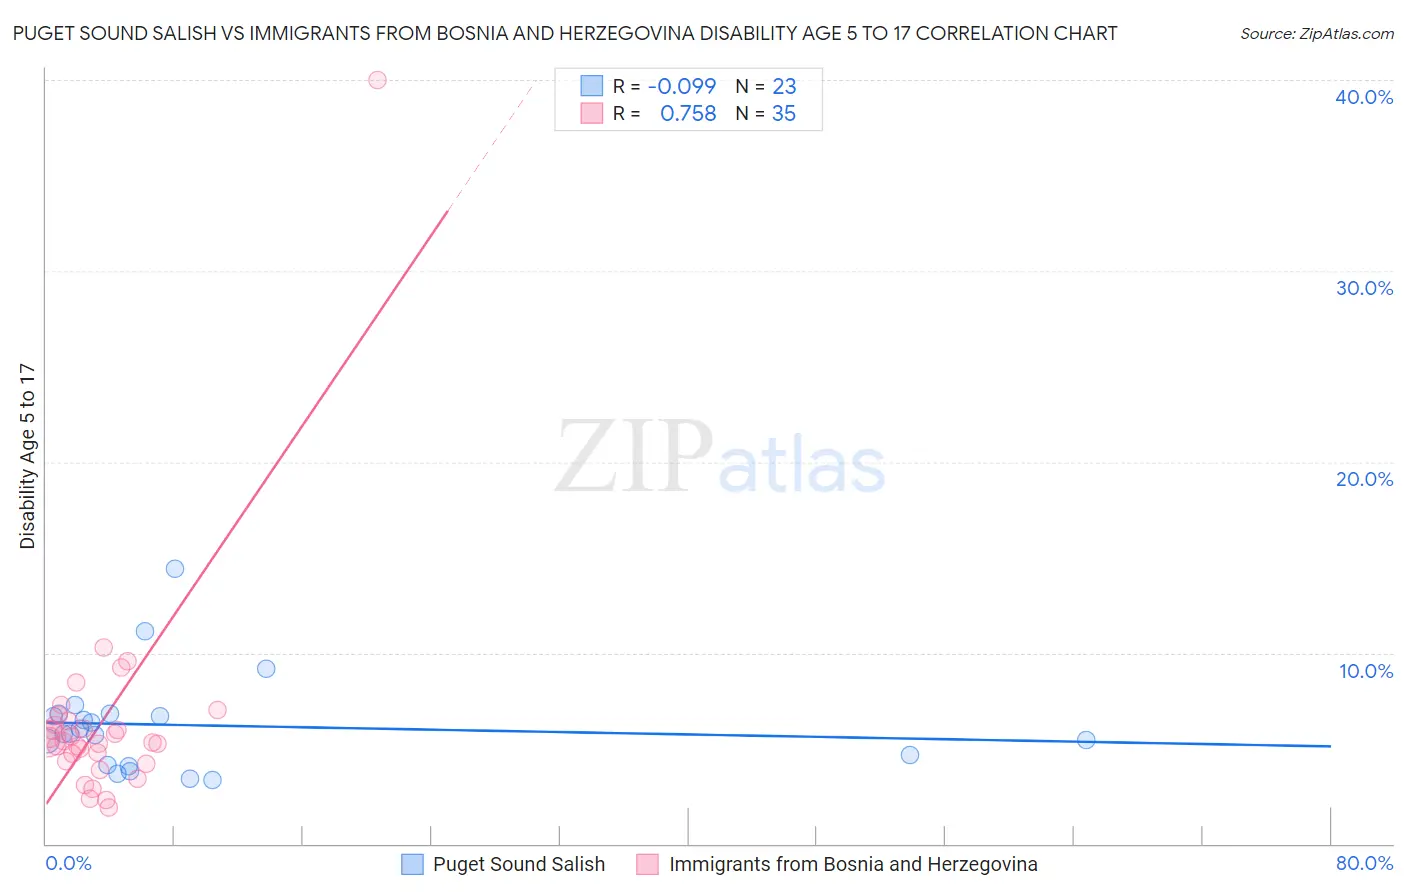
Puget Sound Salish vs Immigrants from Bosnia and Herzegovina Disability Age 5 to 17 Correlation Chart
The statistical analysis conducted on geographies consisting of 46,037,254 people shows a slight negative correlation between the proportion of Puget Sound Salish and percentage of population with a disability between the ages 5 and 17 in the United States with a correlation coefficient (R) of -0.099 and weighted average of 6.1%. Similarly, the statistical analysis conducted on geographies consisting of 156,380,424 people shows a strong positive correlation between the proportion of Immigrants from Bosnia and Herzegovina and percentage of population with a disability between the ages 5 and 17 in the United States with a correlation coefficient (R) of 0.758 and weighted average of 5.7%, a difference of 7.5%.
Disability Age 5 to 17 Correlation Summary
| Measurement | Puget Sound Salish | Immigrants from Bosnia and Herzegovina |
| Minimum | 3.3% | 1.9% |
| Maximum | 14.4% | 40.0% |
| Range | 11.1% | 38.1% |
| Mean | 6.2% | 6.4% |
| Median | 5.8% | 5.3% |
| Interquartile 25% (IQ1) | 4.1% | 4.3% |
| Interquartile 75% (IQ3) | 6.8% | 6.4% |
| Interquartile Range (IQR) | 2.7% | 2.1% |
| Standard Deviation (Sample) | 2.6% | 6.2% |
| Standard Deviation (Population) | 2.5% | 6.1% |
Similar Demographics by Disability Age 5 to 17
Demographics Similar to Puget Sound Salish by Disability Age 5 to 17
In terms of disability age 5 to 17, the demographic groups most similar to Puget Sound Salish are Immigrants from Liberia (6.1%, a difference of 0.080%), Immigrants from Jamaica (6.1%, a difference of 0.22%), Portuguese (6.1%, a difference of 0.36%), Scottish (6.1%, a difference of 0.61%), and Japanese (6.1%, a difference of 0.72%).
| Demographics | Rating | Rank | Disability Age 5 to 17 |
| Immigrants | Somalia | 0.4 /100 | #270 | Tragic 6.0% |
| Immigrants | Zaire | 0.2 /100 | #271 | Tragic 6.0% |
| Finns | 0.2 /100 | #272 | Tragic 6.0% |
| Alaska Natives | 0.2 /100 | #273 | Tragic 6.0% |
| Cheyenne | 0.2 /100 | #274 | Tragic 6.0% |
| Dutch | 0.2 /100 | #275 | Tragic 6.0% |
| Japanese | 0.1 /100 | #276 | Tragic 6.1% |
| Puget Sound Salish | 0.1 /100 | #277 | Tragic 6.1% |
| Immigrants | Liberia | 0.1 /100 | #278 | Tragic 6.1% |
| Immigrants | Jamaica | 0.1 /100 | #279 | Tragic 6.1% |
| Portuguese | 0.1 /100 | #280 | Tragic 6.1% |
| Scottish | 0.0 /100 | #281 | Tragic 6.1% |
| Germans | 0.0 /100 | #282 | Tragic 6.1% |
| Ugandans | 0.0 /100 | #283 | Tragic 6.2% |
| Sub-Saharan Africans | 0.0 /100 | #284 | Tragic 6.2% |
Demographics Similar to Immigrants from Bosnia and Herzegovina by Disability Age 5 to 17
In terms of disability age 5 to 17, the demographic groups most similar to Immigrants from Bosnia and Herzegovina are Danish (5.7%, a difference of 0.010%), Immigrants from Canada (5.7%, a difference of 0.010%), Immigrants from Eastern Africa (5.7%, a difference of 0.060%), Pueblo (5.7%, a difference of 0.070%), and Marshallese (5.7%, a difference of 0.11%).
| Demographics | Rating | Rank | Disability Age 5 to 17 |
| Immigrants | Mexico | 33.7 /100 | #185 | Fair 5.6% |
| Fijians | 31.7 /100 | #186 | Fair 5.7% |
| Immigrants | Thailand | 30.2 /100 | #187 | Fair 5.7% |
| Marshallese | 28.1 /100 | #188 | Fair 5.7% |
| Pueblo | 27.5 /100 | #189 | Fair 5.7% |
| Immigrants | Eastern Africa | 27.3 /100 | #190 | Fair 5.7% |
| Danes | 26.5 /100 | #191 | Fair 5.7% |
| Immigrants | Bosnia and Herzegovina | 26.3 /100 | #192 | Fair 5.7% |
| Immigrants | Canada | 26.1 /100 | #193 | Fair 5.7% |
| Croatians | 23.6 /100 | #194 | Fair 5.7% |
| Immigrants | Nigeria | 23.4 /100 | #195 | Fair 5.7% |
| Inupiat | 23.3 /100 | #196 | Fair 5.7% |
| Immigrants | North America | 23.1 /100 | #197 | Fair 5.7% |
| Norwegians | 20.9 /100 | #198 | Fair 5.7% |
| Northern Europeans | 15.2 /100 | #199 | Poor 5.7% |