Immigrants from Jordan vs English Male Disability
COMPARE
Immigrants from Jordan
English
Male Disability
Male Disability Comparison
Immigrants from Jordan
English
10.6%
MALE DISABILITY
98.4/ 100
METRIC RATING
80th/ 347
METRIC RANK
12.8%
MALE DISABILITY
0.0/ 100
METRIC RATING
292nd/ 347
METRIC RANK
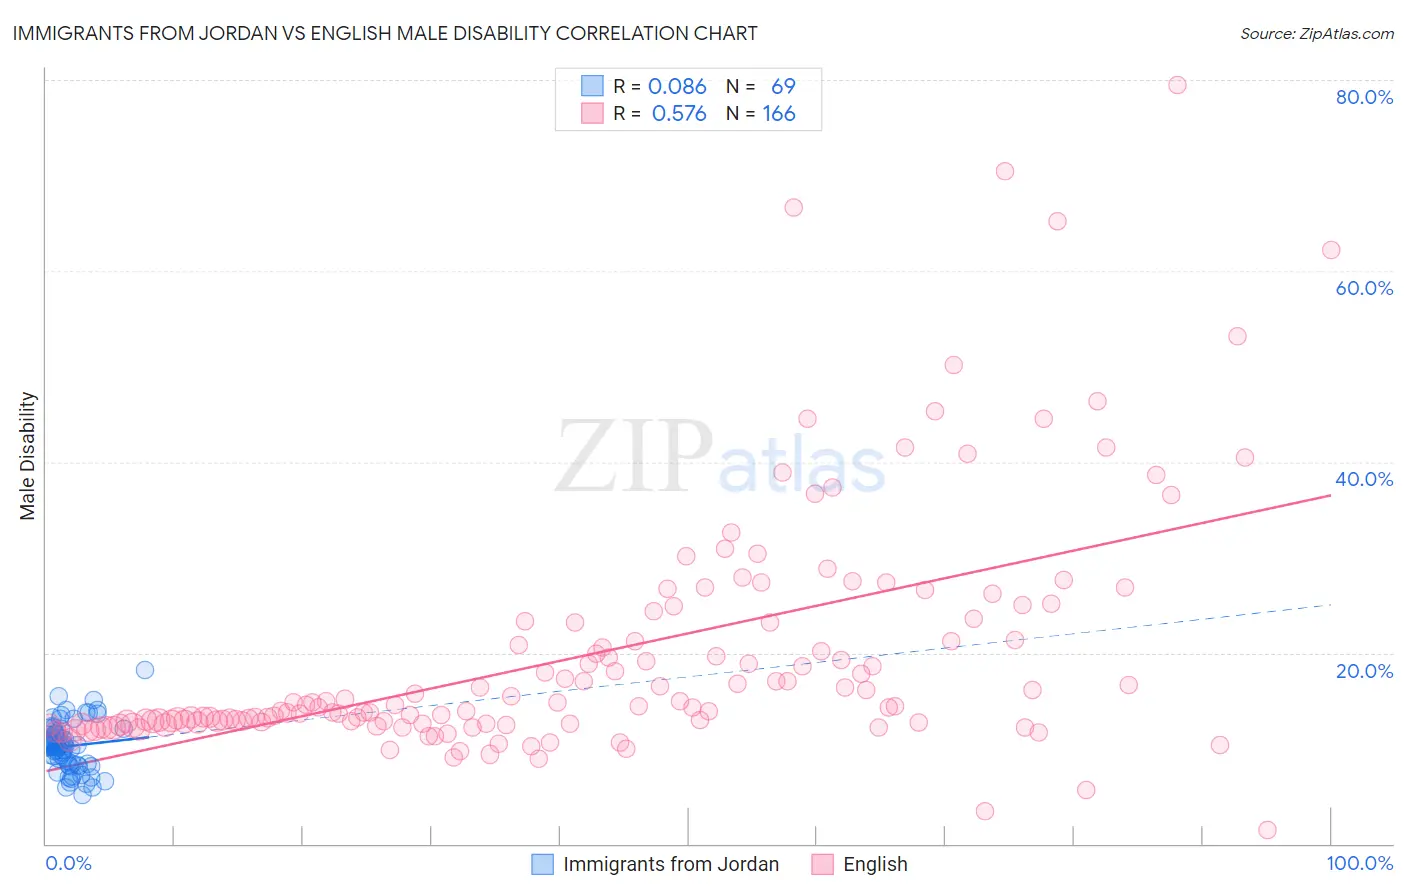
Immigrants from Jordan vs English Male Disability Correlation Chart
The statistical analysis conducted on geographies consisting of 181,276,340 people shows a slight positive correlation between the proportion of Immigrants from Jordan and percentage of males with a disability in the United States with a correlation coefficient (R) of 0.086 and weighted average of 10.6%. Similarly, the statistical analysis conducted on geographies consisting of 579,503,063 people shows a substantial positive correlation between the proportion of English and percentage of males with a disability in the United States with a correlation coefficient (R) of 0.576 and weighted average of 12.8%, a difference of 21.4%.
Male Disability Correlation Summary
| Measurement | Immigrants from Jordan | English |
| Minimum | 5.2% | 1.4% |
| Maximum | 18.2% | 79.4% |
| Range | 13.0% | 78.0% |
| Mean | 10.2% | 19.9% |
| Median | 10.2% | 14.4% |
| Interquartile 25% (IQ1) | 8.3% | 12.6% |
| Interquartile 75% (IQ3) | 11.5% | 23.2% |
| Interquartile Range (IQR) | 3.2% | 10.6% |
| Standard Deviation (Sample) | 2.5% | 12.8% |
| Standard Deviation (Population) | 2.5% | 12.8% |
Similar Demographics by Male Disability
Demographics Similar to Immigrants from Jordan by Male Disability
In terms of male disability, the demographic groups most similar to Immigrants from Jordan are Zimbabwean (10.6%, a difference of 0.020%), Immigrants from Chile (10.6%, a difference of 0.060%), Immigrants from Guyana (10.6%, a difference of 0.13%), Immigrants from Poland (10.6%, a difference of 0.19%), and Bulgarian (10.6%, a difference of 0.20%).
| Demographics | Rating | Rank | Male Disability |
| Immigrants | Lithuania | 98.9 /100 | #73 | Exceptional 10.5% |
| Immigrants | Lebanon | 98.8 /100 | #74 | Exceptional 10.5% |
| Sierra Leoneans | 98.7 /100 | #75 | Exceptional 10.5% |
| Immigrants | Sierra Leone | 98.7 /100 | #76 | Exceptional 10.5% |
| Laotians | 98.6 /100 | #77 | Exceptional 10.6% |
| Immigrants | Russia | 98.6 /100 | #78 | Exceptional 10.6% |
| Zimbabweans | 98.4 /100 | #79 | Exceptional 10.6% |
| Immigrants | Jordan | 98.4 /100 | #80 | Exceptional 10.6% |
| Immigrants | Chile | 98.3 /100 | #81 | Exceptional 10.6% |
| Immigrants | Guyana | 98.2 /100 | #82 | Exceptional 10.6% |
| Immigrants | Poland | 98.1 /100 | #83 | Exceptional 10.6% |
| Bulgarians | 98.1 /100 | #84 | Exceptional 10.6% |
| Sri Lankans | 97.9 /100 | #85 | Exceptional 10.6% |
| Immigrants | Ireland | 97.9 /100 | #86 | Exceptional 10.6% |
| Immigrants | Vietnam | 97.9 /100 | #87 | Exceptional 10.6% |
Demographics Similar to English by Male Disability
In terms of male disability, the demographic groups most similar to English are White/Caucasian (12.8%, a difference of 0.060%), Pima (12.8%, a difference of 0.15%), Yaqui (12.9%, a difference of 0.29%), Immigrants from Cabo Verde (12.8%, a difference of 0.30%), and Yup'ik (12.8%, a difference of 0.49%).
| Demographics | Rating | Rank | Male Disability |
| Welsh | 0.0 /100 | #285 | Tragic 12.7% |
| Scottish | 0.0 /100 | #286 | Tragic 12.8% |
| Cape Verdeans | 0.0 /100 | #287 | Tragic 12.8% |
| Yup'ik | 0.0 /100 | #288 | Tragic 12.8% |
| Immigrants | Cabo Verde | 0.0 /100 | #289 | Tragic 12.8% |
| Pima | 0.0 /100 | #290 | Tragic 12.8% |
| Whites/Caucasians | 0.0 /100 | #291 | Tragic 12.8% |
| English | 0.0 /100 | #292 | Tragic 12.8% |
| Yaqui | 0.0 /100 | #293 | Tragic 12.9% |
| Marshallese | 0.0 /100 | #294 | Tragic 12.9% |
| Immigrants | Micronesia | 0.0 /100 | #295 | Tragic 12.9% |
| Immigrants | Nonimmigrants | 0.0 /100 | #296 | Tragic 12.9% |
| Inupiat | 0.0 /100 | #297 | Tragic 13.0% |
| Pennsylvania Germans | 0.0 /100 | #298 | Tragic 13.0% |
| Celtics | 0.0 /100 | #299 | Tragic 13.0% |