Polish vs Alaskan Athabascan Disability Age Under 5
COMPARE
Polish
Alaskan Athabascan
Disability Age Under 5
Disability Age Under 5 Comparison
Poles
Alaskan Athabascans
1.6%
DISABILITY AGE UNDER 5
0.0/ 100
METRIC RATING
296th/ 347
METRIC RANK
1.5%
DISABILITY AGE UNDER 5
0.1/ 100
METRIC RATING
273rd/ 347
METRIC RANK
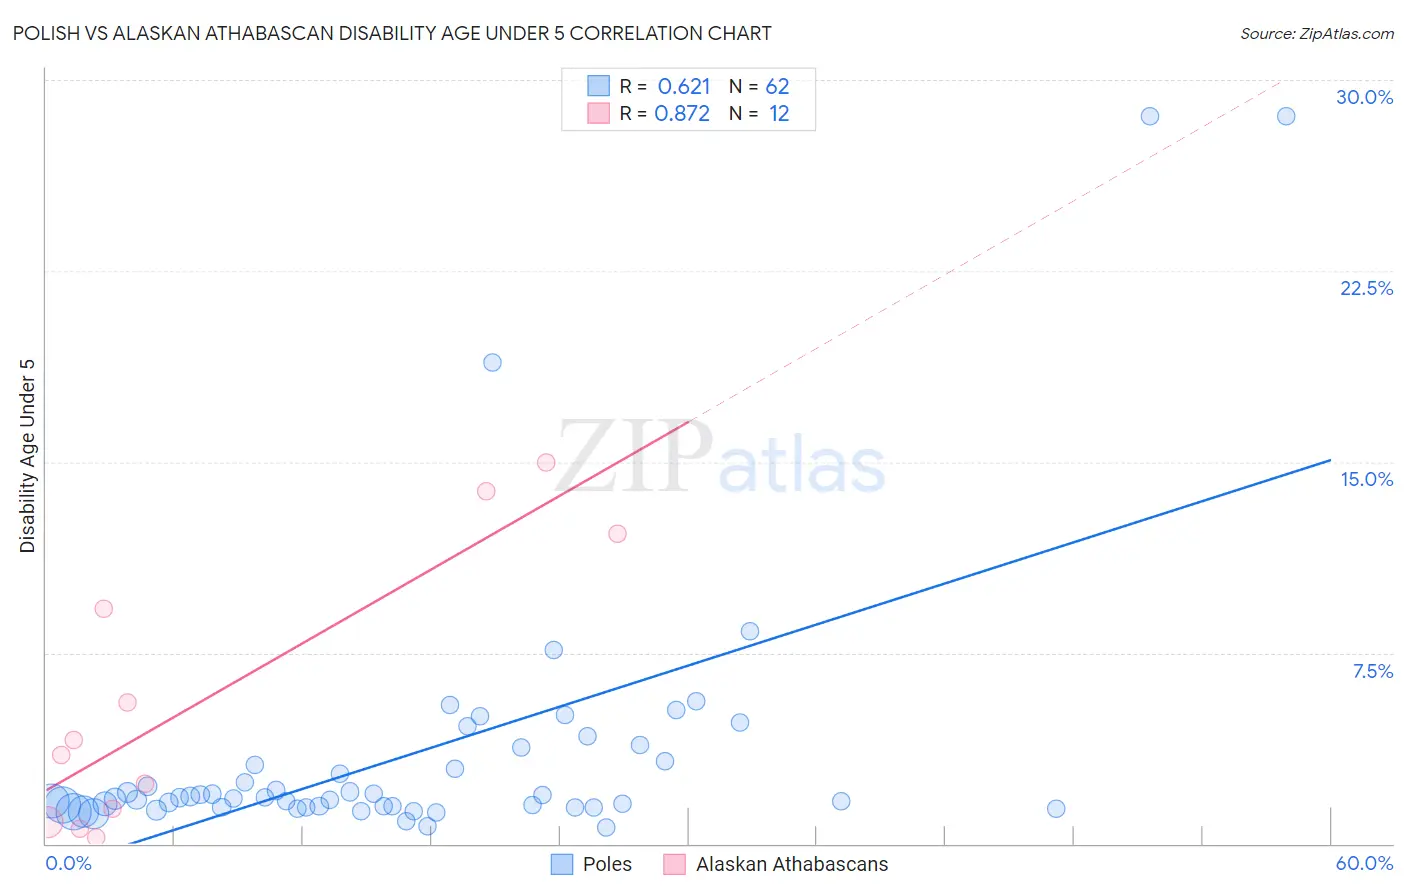
Polish vs Alaskan Athabascan Disability Age Under 5 Correlation Chart
The statistical analysis conducted on geographies consisting of 257,764,935 people shows a significant positive correlation between the proportion of Poles and percentage of population with a disability under the age of 5 in the United States with a correlation coefficient (R) of 0.621 and weighted average of 1.6%. Similarly, the statistical analysis conducted on geographies consisting of 36,074,143 people shows a very strong positive correlation between the proportion of Alaskan Athabascans and percentage of population with a disability under the age of 5 in the United States with a correlation coefficient (R) of 0.872 and weighted average of 1.5%, a difference of 9.7%.
Disability Age Under 5 Correlation Summary
| Measurement | Polish | Alaskan Athabascan |
| Minimum | 0.65% | 0.26% |
| Maximum | 28.6% | 15.0% |
| Range | 27.9% | 14.7% |
| Mean | 3.5% | 5.7% |
| Median | 1.8% | 3.8% |
| Interquartile 25% (IQ1) | 1.4% | 1.1% |
| Interquartile 75% (IQ3) | 3.2% | 10.7% |
| Interquartile Range (IQR) | 1.8% | 9.6% |
| Standard Deviation (Sample) | 5.3% | 5.4% |
| Standard Deviation (Population) | 5.3% | 5.2% |
Similar Demographics by Disability Age Under 5
Demographics Similar to Poles by Disability Age Under 5
In terms of disability age under 5, the demographic groups most similar to Poles are Finnish (1.6%, a difference of 0.080%), Swedish (1.6%, a difference of 0.71%), Nonimmigrants (1.6%, a difference of 0.96%), Cajun (1.6%, a difference of 0.96%), and Portuguese (1.6%, a difference of 1.5%).
| Demographics | Rating | Rank | Disability Age Under 5 |
| Hungarians | 0.0 /100 | #289 | Tragic 1.5% |
| Czechs | 0.0 /100 | #290 | Tragic 1.5% |
| Northern Europeans | 0.0 /100 | #291 | Tragic 1.6% |
| Italians | 0.0 /100 | #292 | Tragic 1.6% |
| Lithuanians | 0.0 /100 | #293 | Tragic 1.6% |
| Swedes | 0.0 /100 | #294 | Tragic 1.6% |
| Finns | 0.0 /100 | #295 | Tragic 1.6% |
| Poles | 0.0 /100 | #296 | Tragic 1.6% |
| Immigrants | Nonimmigrants | 0.0 /100 | #297 | Tragic 1.6% |
| Cajuns | 0.0 /100 | #298 | Tragic 1.6% |
| Portuguese | 0.0 /100 | #299 | Tragic 1.6% |
| Shoshone | 0.0 /100 | #300 | Tragic 1.6% |
| German Russians | 0.0 /100 | #301 | Tragic 1.6% |
| Welsh | 0.0 /100 | #302 | Tragic 1.6% |
| Swiss | 0.0 /100 | #303 | Tragic 1.6% |
Demographics Similar to Alaskan Athabascans by Disability Age Under 5
In terms of disability age under 5, the demographic groups most similar to Alaskan Athabascans are Iroquois (1.5%, a difference of 0.27%), Black/African American (1.4%, a difference of 0.29%), Brazilian (1.5%, a difference of 0.38%), Immigrants from Canada (1.4%, a difference of 0.46%), and Immigrants from North America (1.4%, a difference of 0.50%).
| Demographics | Rating | Rank | Disability Age Under 5 |
| Immigrants | Germany | 0.1 /100 | #266 | Tragic 1.4% |
| Cree | 0.1 /100 | #267 | Tragic 1.4% |
| Belgians | 0.1 /100 | #268 | Tragic 1.4% |
| Austrians | 0.1 /100 | #269 | Tragic 1.4% |
| Immigrants | North America | 0.1 /100 | #270 | Tragic 1.4% |
| Immigrants | Canada | 0.1 /100 | #271 | Tragic 1.4% |
| Blacks/African Americans | 0.1 /100 | #272 | Tragic 1.4% |
| Alaskan Athabascans | 0.1 /100 | #273 | Tragic 1.5% |
| Iroquois | 0.0 /100 | #274 | Tragic 1.5% |
| Brazilians | 0.0 /100 | #275 | Tragic 1.5% |
| Greeks | 0.0 /100 | #276 | Tragic 1.5% |
| Canadians | 0.0 /100 | #277 | Tragic 1.5% |
| Kiowa | 0.0 /100 | #278 | Tragic 1.5% |
| Danes | 0.0 /100 | #279 | Tragic 1.5% |
| British | 0.0 /100 | #280 | Tragic 1.5% |