Immigrants from Micronesia vs Alaskan Athabascan Disability Age Under 5
COMPARE
Immigrants from Micronesia
Alaskan Athabascan
Disability Age Under 5
Disability Age Under 5 Comparison
Immigrants from Micronesia
Alaskan Athabascans
1.0%
DISABILITY AGE UNDER 5
100.0/ 100
METRIC RATING
25th/ 347
METRIC RANK
1.5%
DISABILITY AGE UNDER 5
0.1/ 100
METRIC RATING
273rd/ 347
METRIC RANK
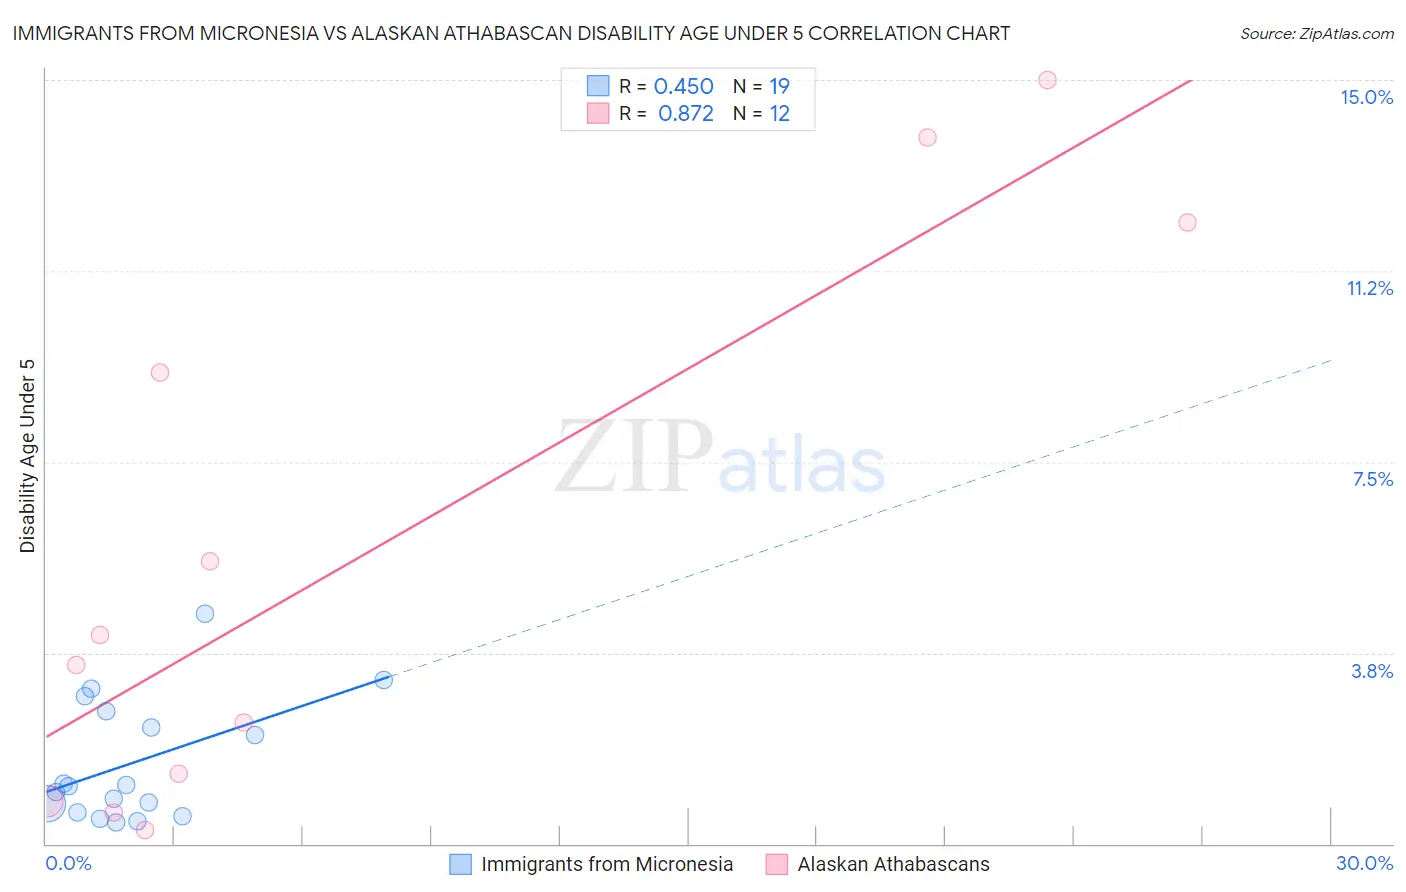
Immigrants from Micronesia vs Alaskan Athabascan Disability Age Under 5 Correlation Chart
The statistical analysis conducted on geographies consisting of 52,170,581 people shows a moderate positive correlation between the proportion of Immigrants from Micronesia and percentage of population with a disability under the age of 5 in the United States with a correlation coefficient (R) of 0.450 and weighted average of 1.0%. Similarly, the statistical analysis conducted on geographies consisting of 36,074,143 people shows a very strong positive correlation between the proportion of Alaskan Athabascans and percentage of population with a disability under the age of 5 in the United States with a correlation coefficient (R) of 0.872 and weighted average of 1.5%, a difference of 44.3%.
Disability Age Under 5 Correlation Summary
| Measurement | Immigrants from Micronesia | Alaskan Athabascan |
| Minimum | 0.42% | 0.26% |
| Maximum | 4.5% | 15.0% |
| Range | 4.1% | 14.7% |
| Mean | 1.6% | 5.7% |
| Median | 1.1% | 3.8% |
| Interquartile 25% (IQ1) | 0.63% | 1.1% |
| Interquartile 75% (IQ3) | 2.6% | 10.7% |
| Interquartile Range (IQR) | 2.0% | 9.6% |
| Standard Deviation (Sample) | 1.2% | 5.4% |
| Standard Deviation (Population) | 1.2% | 5.2% |
Similar Demographics by Disability Age Under 5
Demographics Similar to Immigrants from Micronesia by Disability Age Under 5
In terms of disability age under 5, the demographic groups most similar to Immigrants from Micronesia are Immigrants from Taiwan (1.0%, a difference of 0.12%), Indian (Asian) (1.0%, a difference of 0.31%), Yakama (1.00%, a difference of 0.59%), Immigrants from Iran (1.00%, a difference of 0.67%), and Guyanese (1.0%, a difference of 0.97%).
| Demographics | Rating | Rank | Disability Age Under 5 |
| Immigrants | Barbados | 100.0 /100 | #18 | Exceptional 0.97% |
| Puget Sound Salish | 100.0 /100 | #19 | Exceptional 0.97% |
| Nepalese | 100.0 /100 | #20 | Exceptional 0.97% |
| British West Indians | 100.0 /100 | #21 | Exceptional 0.99% |
| Immigrants | Iran | 100.0 /100 | #22 | Exceptional 1.00% |
| Yakama | 100.0 /100 | #23 | Exceptional 1.00% |
| Indians (Asian) | 100.0 /100 | #24 | Exceptional 1.0% |
| Immigrants | Micronesia | 100.0 /100 | #25 | Exceptional 1.0% |
| Immigrants | Taiwan | 100.0 /100 | #26 | Exceptional 1.0% |
| Guyanese | 100.0 /100 | #27 | Exceptional 1.0% |
| Immigrants | Eastern Asia | 100.0 /100 | #28 | Exceptional 1.0% |
| Immigrants | Belarus | 100.0 /100 | #29 | Exceptional 1.0% |
| Immigrants | South Central Asia | 99.9 /100 | #30 | Exceptional 1.0% |
| Armenians | 99.9 /100 | #31 | Exceptional 1.0% |
| Iranians | 99.9 /100 | #32 | Exceptional 1.0% |
Demographics Similar to Alaskan Athabascans by Disability Age Under 5
In terms of disability age under 5, the demographic groups most similar to Alaskan Athabascans are Iroquois (1.5%, a difference of 0.27%), Black/African American (1.4%, a difference of 0.29%), Brazilian (1.5%, a difference of 0.38%), Immigrants from Canada (1.4%, a difference of 0.46%), and Immigrants from North America (1.4%, a difference of 0.50%).
| Demographics | Rating | Rank | Disability Age Under 5 |
| Immigrants | Germany | 0.1 /100 | #266 | Tragic 1.4% |
| Cree | 0.1 /100 | #267 | Tragic 1.4% |
| Belgians | 0.1 /100 | #268 | Tragic 1.4% |
| Austrians | 0.1 /100 | #269 | Tragic 1.4% |
| Immigrants | North America | 0.1 /100 | #270 | Tragic 1.4% |
| Immigrants | Canada | 0.1 /100 | #271 | Tragic 1.4% |
| Blacks/African Americans | 0.1 /100 | #272 | Tragic 1.4% |
| Alaskan Athabascans | 0.1 /100 | #273 | Tragic 1.5% |
| Iroquois | 0.0 /100 | #274 | Tragic 1.5% |
| Brazilians | 0.0 /100 | #275 | Tragic 1.5% |
| Greeks | 0.0 /100 | #276 | Tragic 1.5% |
| Canadians | 0.0 /100 | #277 | Tragic 1.5% |
| Kiowa | 0.0 /100 | #278 | Tragic 1.5% |
| Danes | 0.0 /100 | #279 | Tragic 1.5% |
| British | 0.0 /100 | #280 | Tragic 1.5% |