Polish vs Alaskan Athabascan Receiving Food Stamps

COMPARE

Polish
Race
Ancestry
AfghanAfricanAlaska NativeAlbanianAleutAlsatianAmericanApacheArabArapahoArgentineanArmenianAssyrian/Chaldean/SyriacAustralianAustrianBahamianBangladeshiBarbadianBasqueBelgianBelizeanBermudanBhutaneseBlackfeetBolivianBrazilianBritishBritish West IndianBulgarianBurmeseCajunCambodianCanadianCape VerdeanCarpatho RusynCelticCentral AmericanCentral American IndianCherokeeCheyenneChickasawChileanChineseChippewaChoctawColombianColvilleComancheCosta RicanCreeCreekCroatianCrowCubanCypriotCzechCzechoslovakianDanishDelawareDominicanDutchDutch West IndianEastern EuropeanEcuadorianEgyptianEnglishEstonianEthiopianEuropeanFijianFilipinoFinnishFrenchFrench American IndianFrench CanadianGermanGerman RussianGhanaianGreekGuamanian/ChamorroGuatemalanGuyaneseHaitianHmongHonduranHopiHoumaHungarianIcelanderIndian (Asian)IndonesianInupiatIranianIraqiIrishIroquoisIsraeliItalianJamaicanJapaneseJordanianKenyanKiowaKoreanLaotianLatvianLebaneseLiberianLithuanianLumbeeLuxembourgerMacedonianMalaysianMalteseMarshalleseMenomineeMexicanMexican American IndianMongolianMoroccanNative HawaiianNavajoNepaleseNew ZealanderNicaraguanNigerianNorthern EuropeanNorwegianOkinawanOsageOttawaPaiutePakistaniPalestinianPanamanianParaguayanPennsylvania GermanPeruvianPimaPolishPortuguesePotawatomiPuebloPuerto RicanPuget Sound SalishRomanianRussianSalvadoranSamoanScandinavianScotch-IrishScottishSeminoleSenegaleseSerbianShoshoneSierra LeoneanSiouxSlavicSlovakSloveneSomaliSouth AfricanSouth AmericanSouth American IndianSoviet UnionSpaniardSpanishSpanish AmericanSpanish American IndianSri LankanSubsaharan AfricanSudaneseSwedishSwissSyrianTaiwaneseThaiTlingit-HaidaTohono O'OdhamTonganTrinidadian and TobagonianTsimshianTurkishU.S. Virgin IslanderUgandanUkrainianUruguayanUteVenezuelanVietnameseWelshWest IndianYakamaYaquiYugoslavianYumanYup'ikZimbabwean
Immigration
NonimmigrantsImmigrantsAfghanistanAfricaAlbaniaArgentinaArmeniaAsiaAustraliaAustriaBahamasBangladeshBarbadosBelarusBelgiumBelizeBoliviaBosnia and HerzegovinaBrazilBulgariaBurma/MyanmarCabo VerdeCambodiaCameroonCanadaCaribbeanCentral AmericaChileChinaColombiaCongoCosta RicaCroatiaCubaCzechoslovakiaDenmarkDominicaDominican RepublicEastern AfricaEastern AsiaEastern EuropeEcuadorEgyptEl SalvadorEnglandEritreaEthiopiaEuropeFijiFranceGermanyGhanaGreeceGrenadaGuatemalaGuyanaHaitiHondurasHong KongHungaryIndiaIndonesiaIranIraqIrelandIsraelItalyJamaicaJapanJordanKazakhstanKenyaKoreaKuwaitLaosLatin AmericaLatviaLebanonLiberiaLithuaniaMalaysiaMexicoMicronesiaMiddle AfricaMoldovaMoroccoNepalNetherlandsNicaraguaNigeriaNorth AmericaNorth MacedoniaNorthern AfricaNorthern EuropeNorwayOceaniaPakistanPanamaPeruPhilippinesPolandPortugalRomaniaRussiaSaudi ArabiaScotlandSenegalSerbiaSierra LeoneSingaporeSomaliaSouth AfricaSouth AmericaSouth Central AsiaSouth Eastern AsiaSouthern EuropeSpainSri LankaSt. Vincent and the GrenadinesSudanSwedenSwitzerlandSyriaTaiwanThailandTrinidad and TobagoTurkeyUgandaUkraineUruguayUzbekistanVenezuelaVietnamWest IndiesWestern AfricaWestern AsiaWestern EuropeYemenZaireZimbabweAzores
Alaskan Athabascan
Race
Ancestry
AfghanAfricanAlaska NativeAlaskan AthabascanAlbanianAleutAlsatianAmericanApacheArabArapahoArgentineanArmenianAssyrian/Chaldean/SyriacAustralianAustrianBahamianBangladeshiBarbadianBasqueBelgianBelizeanBermudanBhutaneseBlackfeetBolivianBrazilianBritishBritish West IndianBulgarianBurmeseCajunCambodianCanadianCape VerdeanCarpatho RusynCelticCentral AmericanCentral American IndianCherokeeCheyenneChickasawChileanChineseChippewaChoctawColombianColvilleComancheCosta RicanCreeCreekCroatianCrowCubanCypriotCzechCzechoslovakianDanishDelawareDominicanDutchDutch West IndianEastern EuropeanEcuadorianEgyptianEnglishEstonianEthiopianEuropeanFijianFilipinoFinnishFrenchFrench American IndianFrench CanadianGermanGerman RussianGhanaianGreekGuamanian/ChamorroGuatemalanGuyaneseHaitianHmongHonduranHopiHoumaHungarianIcelanderIndian (Asian)IndonesianInupiatIranianIraqiIrishIroquoisIsraeliItalianJamaicanJapaneseJordanianKenyanKiowaKoreanLaotianLatvianLebaneseLiberianLithuanianLumbeeLuxembourgerMacedonianMalaysianMalteseMarshalleseMenomineeMexicanMexican American IndianMongolianMoroccanNative HawaiianNavajoNepaleseNew ZealanderNicaraguanNigerianNorthern EuropeanNorwegianOkinawanOsageOttawaPaiutePakistaniPalestinianPanamanianParaguayanPennsylvania GermanPeruvianPimaPortuguesePotawatomiPuebloPuerto RicanPuget Sound SalishRomanianRussianSalvadoranSamoanScandinavianScotch-IrishScottishSeminoleSenegaleseSerbianShoshoneSierra LeoneanSiouxSlavicSlovakSloveneSomaliSouth AfricanSouth AmericanSouth American IndianSoviet UnionSpaniardSpanishSpanish AmericanSpanish American IndianSri LankanSubsaharan AfricanSudaneseSwedishSwissSyrianTaiwaneseThaiTlingit-HaidaTohono O'OdhamTonganTrinidadian and TobagonianTsimshianTurkishU.S. Virgin IslanderUgandanUkrainianUruguayanUteVenezuelanVietnameseWelshWest IndianYakamaYaquiYugoslavianYumanYup'ikZimbabwean
Immigration
NonimmigrantsImmigrantsAfghanistanAfricaAlbaniaArgentinaArmeniaAsiaAustraliaAustriaBahamasBangladeshBarbadosBelarusBelgiumBelizeBoliviaBosnia and HerzegovinaBrazilBulgariaBurma/MyanmarCabo VerdeCambodiaCameroonCanadaCaribbeanCentral AmericaChileChinaColombiaCongoCosta RicaCroatiaCubaCzechoslovakiaDenmarkDominicaDominican RepublicEastern AfricaEastern AsiaEastern EuropeEcuadorEgyptEl SalvadorEnglandEritreaEthiopiaEuropeFijiFranceGermanyGhanaGreeceGrenadaGuatemalaGuyanaHaitiHondurasHong KongHungaryIndiaIndonesiaIranIraqIrelandIsraelItalyJamaicaJapanJordanKazakhstanKenyaKoreaKuwaitLaosLatin AmericaLatviaLebanonLiberiaLithuaniaMalaysiaMexicoMicronesiaMiddle AfricaMoldovaMoroccoNepalNetherlandsNicaraguaNigeriaNorth AmericaNorth MacedoniaNorthern AfricaNorthern EuropeNorwayOceaniaPakistanPanamaPeruPhilippinesPolandPortugalRomaniaRussiaSaudi ArabiaScotlandSenegalSerbiaSierra LeoneSingaporeSomaliaSouth AfricaSouth AmericaSouth Central AsiaSouth Eastern AsiaSouthern EuropeSpainSri LankaSt. Vincent and the GrenadinesSudanSwedenSwitzerlandSyriaTaiwanThailandTrinidad and TobagoTurkeyUgandaUkraineUruguayUzbekistanVenezuelaVietnamWest IndiesWestern AfricaWestern AsiaWestern EuropeYemenZaireZimbabweAzores
Receiving Food Stamps
Income
Poverty
Unemployment
Labor Participation
Family Structure
Vehicle Availability
Education Level
Disability

Receiving Food Stamps Comparison

Poles

Alaskan Athabascans

Exceptional
Tragic
10.0%
RECEIVING FOOD STAMPS
98.6/ 100
METRIC RATING
80th/ 347
METRIC RANK
14.7%
RECEIVING FOOD STAMPS
0.1/ 100
METRIC RATING
273rd/ 347
METRIC RANK

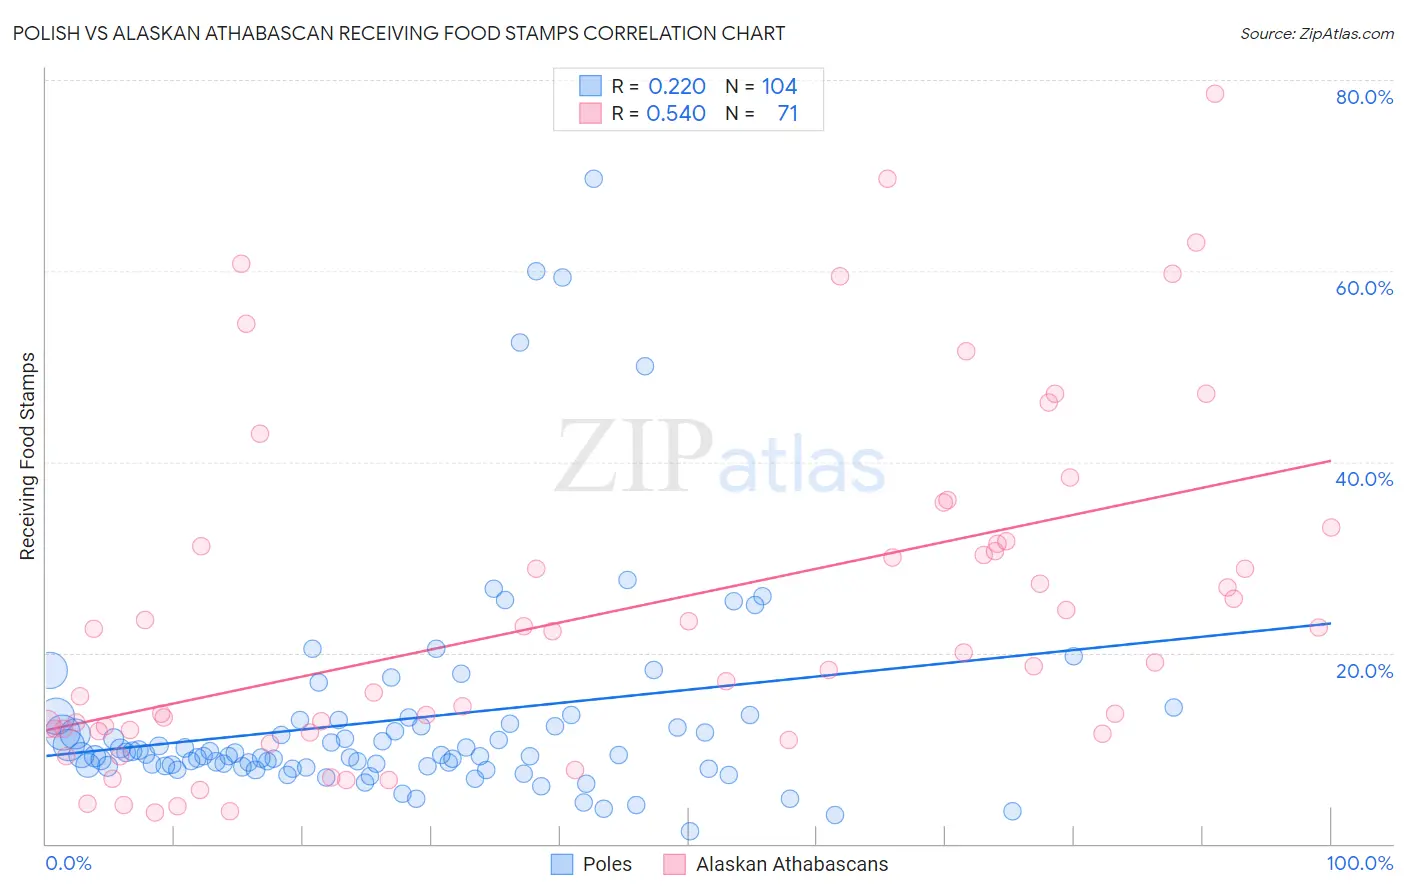
Polish vs Alaskan Athabascan Receiving Food Stamps Correlation Chart

The statistical analysis conducted on geographies consisting of 556,985,146 people shows a weak positive correlation between the proportion of Poles and percentage of population receiving government assistance and/or food stamps in the United States with a correlation coefficient (R) of 0.220 and weighted average of 10.0%. Similarly, the statistical analysis conducted on geographies consisting of 45,801,504 people shows a substantial positive correlation between the proportion of Alaskan Athabascans and percentage of population receiving government assistance and/or food stamps in the United States with a correlation coefficient (R) of 0.540 and weighted average of 14.7%, a difference of 47.2%.
Polish vs Alaskan Athabascan Receiving Food Stamps

Receiving Food Stamps Correlation Summary

MeasurementPolishAlaskan Athabascan
Minimum1.3%3.3%
Maximum69.7%78.5%
Range68.4%75.2%
Mean13.0%24.2%
Median9.3%19.0%
Interquartile 25% (IQ1)8.1%11.8%
Interquartile 75% (IQ3)12.7%31.4%
Interquartile Range (IQR)4.6%19.6%
Standard Deviation (Sample)11.6%17.7%
Standard Deviation (Population)11.5%17.5%

Similar Demographics by Receiving Food Stamps

Demographics Similar to Poles by Receiving Food Stamps

In terms of receiving food stamps, the demographic groups most similar to Poles are Laotian (10.0%, a difference of 0.080%), South African (10.0%, a difference of 0.12%), Immigrants from England (10.0%, a difference of 0.14%), Immigrants from North Macedonia (10.0%, a difference of 0.16%), and Immigrants from Croatia (10.0%, a difference of 0.25%).
DemographicsRating | RankReceiving Food Stamps
Macedonians
98.9
/100
|
#73
Exceptional
9.9%
New Zealanders
98.8
/100
|
#74
Exceptional
9.9%
Immigrants | Zimbabwe
98.7
/100
|
#75
Exceptional
9.9%
Immigrants | Croatia
98.7
/100
|
#76
Exceptional
10.0%
Immigrants | North Macedonia
98.7
/100
|
#77
Exceptional
10.0%
South Africans
98.7
/100
|
#78
Exceptional
10.0%
Laotians
98.7
/100
|
#79
Exceptional
10.0%
Poles
98.6
/100
|
#80
Exceptional
10.0%
Immigrants | England
98.6
/100
|
#81
Exceptional
10.0%
Austrians
98.6
/100
|
#82
Exceptional
10.0%
Dutch
98.6
/100
|
#83
Exceptional
10.0%
Immigrants | Israel
98.5
/100
|
#84
Exceptional
10.0%
Immigrants | Romania
98.5
/100
|
#85
Exceptional
10.0%
Immigrants | Norway
98.4
/100
|
#86
Exceptional
10.0%
Egyptians
98.4
/100
|
#87
Exceptional
10.0%

Demographics Similar to Alaskan Athabascans by Receiving Food Stamps

In terms of receiving food stamps, the demographic groups most similar to Alaskan Athabascans are Immigrants from Western Africa (14.7%, a difference of 0.020%), Chippewa (14.7%, a difference of 0.030%), Ute (14.7%, a difference of 0.10%), Immigrants from Guatemala (14.6%, a difference of 0.25%), and Mexican (14.6%, a difference of 0.35%).
DemographicsRating | RankReceiving Food Stamps
Cheyenne
0.2
/100
|
#266
Tragic
14.3%
Dutch West Indians
0.2
/100
|
#267
Tragic
14.3%
Guatemalans
0.1
/100
|
#268
Tragic
14.4%
Nepalese
0.1
/100
|
#269
Tragic
14.6%
Mexicans
0.1
/100
|
#270
Tragic
14.6%
Immigrants | Guatemala
0.1
/100
|
#271
Tragic
14.6%
Chippewa
0.1
/100
|
#272
Tragic
14.7%
Alaskan Athabascans
0.1
/100
|
#273
Tragic
14.7%
Immigrants | Western Africa
0.1
/100
|
#274
Tragic
14.7%
Ute
0.1
/100
|
#275
Tragic
14.7%
Liberians
0.1
/100
|
#276
Tragic
14.8%
Seminole
0.1
/100
|
#277
Tragic
14.8%
Belizeans
0.1
/100
|
#278
Tragic
14.8%
Kiowa
0.0
/100
|
#279
Tragic
14.9%
Ecuadorians
0.0
/100
|
#280
Tragic
14.9%