Polish vs Danish Disability Age Under 5
COMPARE
Polish
Danish
Disability Age Under 5
Disability Age Under 5 Comparison
Poles
Danes
1.6%
DISABILITY AGE UNDER 5
0.0/ 100
METRIC RATING
296th/ 347
METRIC RANK
1.5%
DISABILITY AGE UNDER 5
0.0/ 100
METRIC RATING
279th/ 347
METRIC RANK
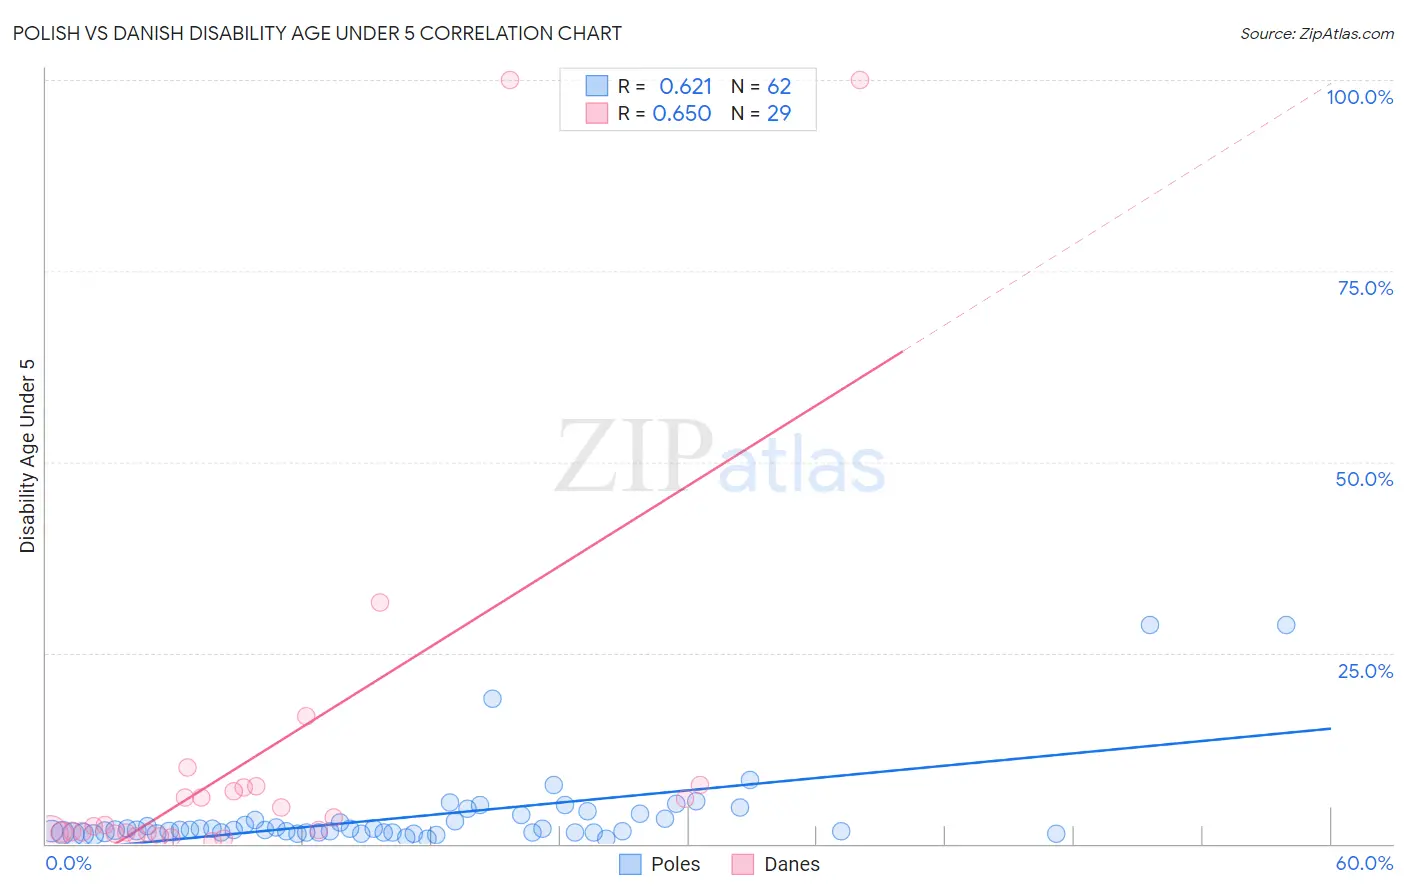
Polish vs Danish Disability Age Under 5 Correlation Chart
The statistical analysis conducted on geographies consisting of 257,764,935 people shows a significant positive correlation between the proportion of Poles and percentage of population with a disability under the age of 5 in the United States with a correlation coefficient (R) of 0.621 and weighted average of 1.6%. Similarly, the statistical analysis conducted on geographies consisting of 235,175,011 people shows a significant positive correlation between the proportion of Danes and percentage of population with a disability under the age of 5 in the United States with a correlation coefficient (R) of 0.650 and weighted average of 1.5%, a difference of 7.8%.
Disability Age Under 5 Correlation Summary
| Measurement | Polish | Danish |
| Minimum | 0.65% | 0.30% |
| Maximum | 28.6% | 100.0% |
| Range | 27.9% | 99.7% |
| Mean | 3.5% | 11.5% |
| Median | 1.8% | 2.5% |
| Interquartile 25% (IQ1) | 1.4% | 1.4% |
| Interquartile 75% (IQ3) | 3.2% | 7.4% |
| Interquartile Range (IQR) | 1.8% | 6.0% |
| Standard Deviation (Sample) | 5.3% | 25.3% |
| Standard Deviation (Population) | 5.3% | 24.8% |
Demographics Similar to Poles and Danes by Disability Age Under 5
In terms of disability age under 5, the demographic groups most similar to Poles are Finnish (1.6%, a difference of 0.080%), Swedish (1.6%, a difference of 0.71%), Nonimmigrants (1.6%, a difference of 0.96%), Lithuanian (1.6%, a difference of 1.9%), and Italian (1.6%, a difference of 2.4%). Similarly, the demographic groups most similar to Danes are Kiowa (1.5%, a difference of 0.010%), Canadian (1.5%, a difference of 0.090%), British (1.5%, a difference of 0.76%), Czechoslovakian (1.5%, a difference of 2.4%), and Cheyenne (1.5%, a difference of 2.8%).
| Demographics | Rating | Rank | Disability Age Under 5 |
| Canadians | 0.0 /100 | #277 | Tragic 1.5% |
| Kiowa | 0.0 /100 | #278 | Tragic 1.5% |
| Danes | 0.0 /100 | #279 | Tragic 1.5% |
| British | 0.0 /100 | #280 | Tragic 1.5% |
| Czechoslovakians | 0.0 /100 | #281 | Tragic 1.5% |
| Cheyenne | 0.0 /100 | #282 | Tragic 1.5% |
| Delaware | 0.0 /100 | #283 | Tragic 1.5% |
| Europeans | 0.0 /100 | #284 | Tragic 1.5% |
| Croatians | 0.0 /100 | #285 | Tragic 1.5% |
| Tlingit-Haida | 0.0 /100 | #286 | Tragic 1.5% |
| Scandinavians | 0.0 /100 | #287 | Tragic 1.5% |
| Estonians | 0.0 /100 | #288 | Tragic 1.5% |
| Hungarians | 0.0 /100 | #289 | Tragic 1.5% |
| Czechs | 0.0 /100 | #290 | Tragic 1.5% |
| Northern Europeans | 0.0 /100 | #291 | Tragic 1.6% |
| Italians | 0.0 /100 | #292 | Tragic 1.6% |
| Lithuanians | 0.0 /100 | #293 | Tragic 1.6% |
| Swedes | 0.0 /100 | #294 | Tragic 1.6% |
| Finns | 0.0 /100 | #295 | Tragic 1.6% |
| Poles | 0.0 /100 | #296 | Tragic 1.6% |
| Immigrants | Nonimmigrants | 0.0 /100 | #297 | Tragic 1.6% |