Polish vs Alaskan Athabascan Householder Income Over 65 years
COMPARE
Polish
Alaskan Athabascan
Householder Income Over 65 years
Householder Income Over 65 years Comparison
Poles
Alaskan Athabascans
$61,598
HOUSEHOLDER INCOME OVER 65 YEARS
65.9/ 100
METRIC RATING
155th/ 347
METRIC RANK
$62,330
HOUSEHOLDER INCOME OVER 65 YEARS
80.6/ 100
METRIC RATING
136th/ 347
METRIC RANK
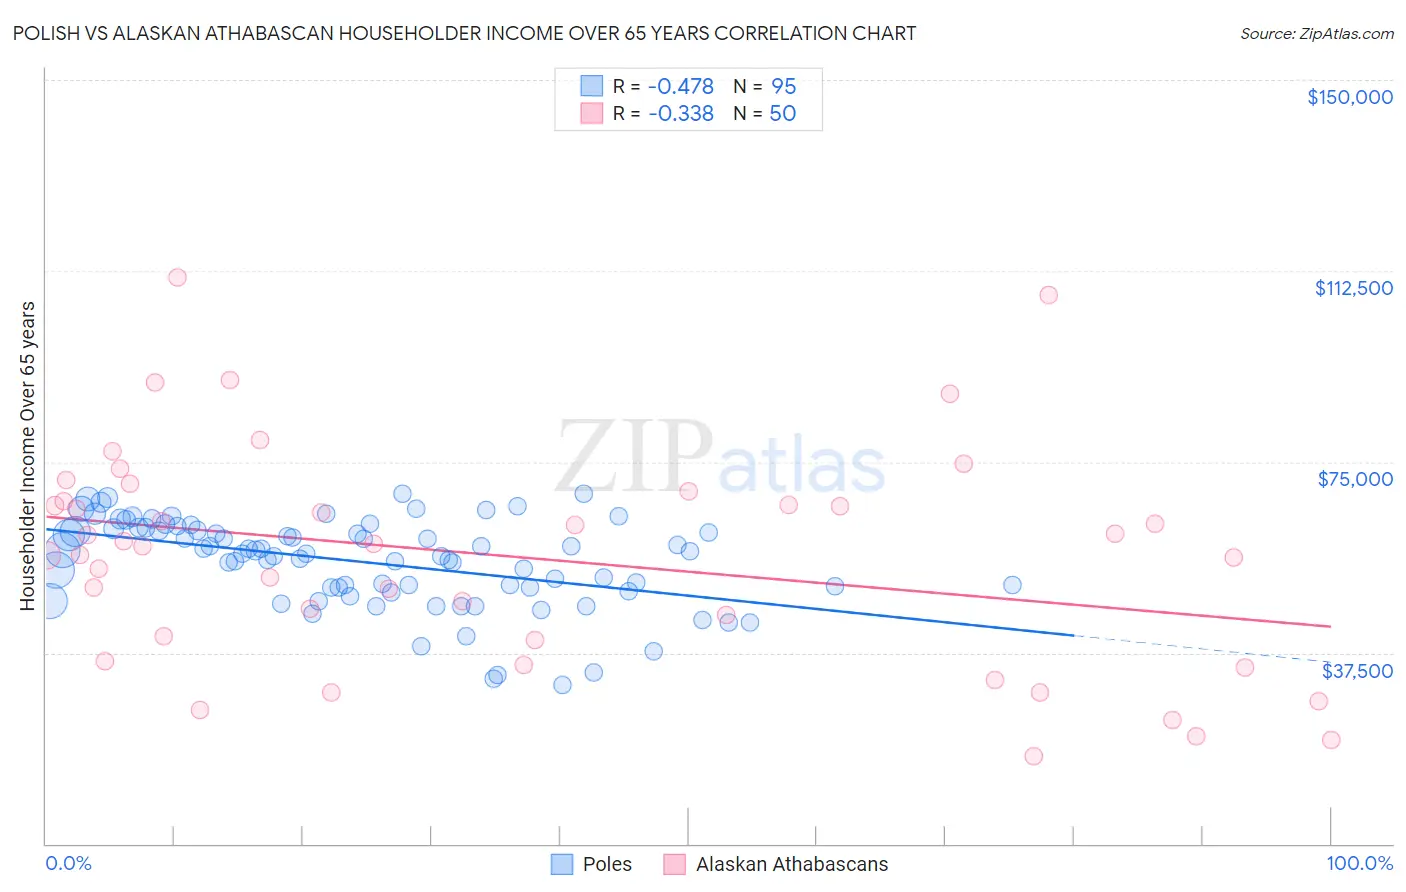
Polish vs Alaskan Athabascan Householder Income Over 65 years Correlation Chart
The statistical analysis conducted on geographies consisting of 555,812,342 people shows a moderate negative correlation between the proportion of Poles and household income with householder over the age of 65 in the United States with a correlation coefficient (R) of -0.478 and weighted average of $61,598. Similarly, the statistical analysis conducted on geographies consisting of 45,769,893 people shows a mild negative correlation between the proportion of Alaskan Athabascans and household income with householder over the age of 65 in the United States with a correlation coefficient (R) of -0.338 and weighted average of $62,330, a difference of 1.2%.
Householder Income Over 65 years Correlation Summary
| Measurement | Polish | Alaskan Athabascan |
| Minimum | $31,125 | $17,188 |
| Maximum | $68,837 | $111,125 |
| Range | $37,712 | $93,937 |
| Mean | $55,277 | $56,372 |
| Median | $57,047 | $58,696 |
| Interquartile 25% (IQ1) | $50,250 | $40,000 |
| Interquartile 75% (IQ3) | $61,924 | $67,202 |
| Interquartile Range (IQR) | $11,674 | $27,202 |
| Standard Deviation (Sample) | $8,677 | $21,725 |
| Standard Deviation (Population) | $8,631 | $21,506 |
Demographics Similar to Poles and Alaskan Athabascans by Householder Income Over 65 years
In terms of householder income over 65 years, the demographic groups most similar to Poles are Swiss ($61,621, a difference of 0.040%), Costa Rican ($61,638, a difference of 0.060%), Armenian ($61,656, a difference of 0.090%), Hungarian ($61,673, a difference of 0.12%), and Slavic ($61,709, a difference of 0.18%). Similarly, the demographic groups most similar to Alaskan Athabascans are Immigrants from Chile ($62,354, a difference of 0.040%), Immigrants from Syria ($62,303, a difference of 0.040%), Immigrants from Kazakhstan ($62,292, a difference of 0.060%), Lebanese ($62,287, a difference of 0.070%), and Arab ($62,266, a difference of 0.10%).
| Demographics | Rating | Rank | Householder Income Over 65 years |
| Immigrants | Chile | 81.0 /100 | #135 | Excellent $62,354 |
| Alaskan Athabascans | 80.6 /100 | #136 | Excellent $62,330 |
| Immigrants | Syria | 80.2 /100 | #137 | Excellent $62,303 |
| Immigrants | Kazakhstan | 80.0 /100 | #138 | Excellent $62,292 |
| Lebanese | 79.9 /100 | #139 | Good $62,287 |
| Arabs | 79.6 /100 | #140 | Good $62,266 |
| Canadians | 79.0 /100 | #141 | Good $62,230 |
| South American Indians | 78.7 /100 | #142 | Good $62,215 |
| Immigrants | Belarus | 77.8 /100 | #143 | Good $62,162 |
| Immigrants | Peru | 74.4 /100 | #144 | Good $61,988 |
| Immigrants | Uganda | 74.2 /100 | #145 | Good $61,976 |
| Immigrants | Southern Europe | 72.7 /100 | #146 | Good $61,902 |
| Immigrants | Nepal | 71.4 /100 | #147 | Good $61,843 |
| Alsatians | 70.5 /100 | #148 | Good $61,797 |
| Scottish | 69.1 /100 | #149 | Good $61,735 |
| Slavs | 68.5 /100 | #150 | Good $61,709 |
| Hungarians | 67.7 /100 | #151 | Good $61,673 |
| Armenians | 67.3 /100 | #152 | Good $61,656 |
| Costa Ricans | 66.9 /100 | #153 | Good $61,638 |
| Swiss | 66.5 /100 | #154 | Good $61,621 |
| Poles | 65.9 /100 | #155 | Good $61,598 |