Polish vs Immigrants from Africa Disability Age Under 5
COMPARE
Polish
Immigrants from Africa
Disability Age Under 5
Disability Age Under 5 Comparison
Poles
Immigrants from Africa
1.6%
DISABILITY AGE UNDER 5
0.0/ 100
METRIC RATING
296th/ 347
METRIC RANK
1.2%
DISABILITY AGE UNDER 5
65.1/ 100
METRIC RATING
161st/ 347
METRIC RANK
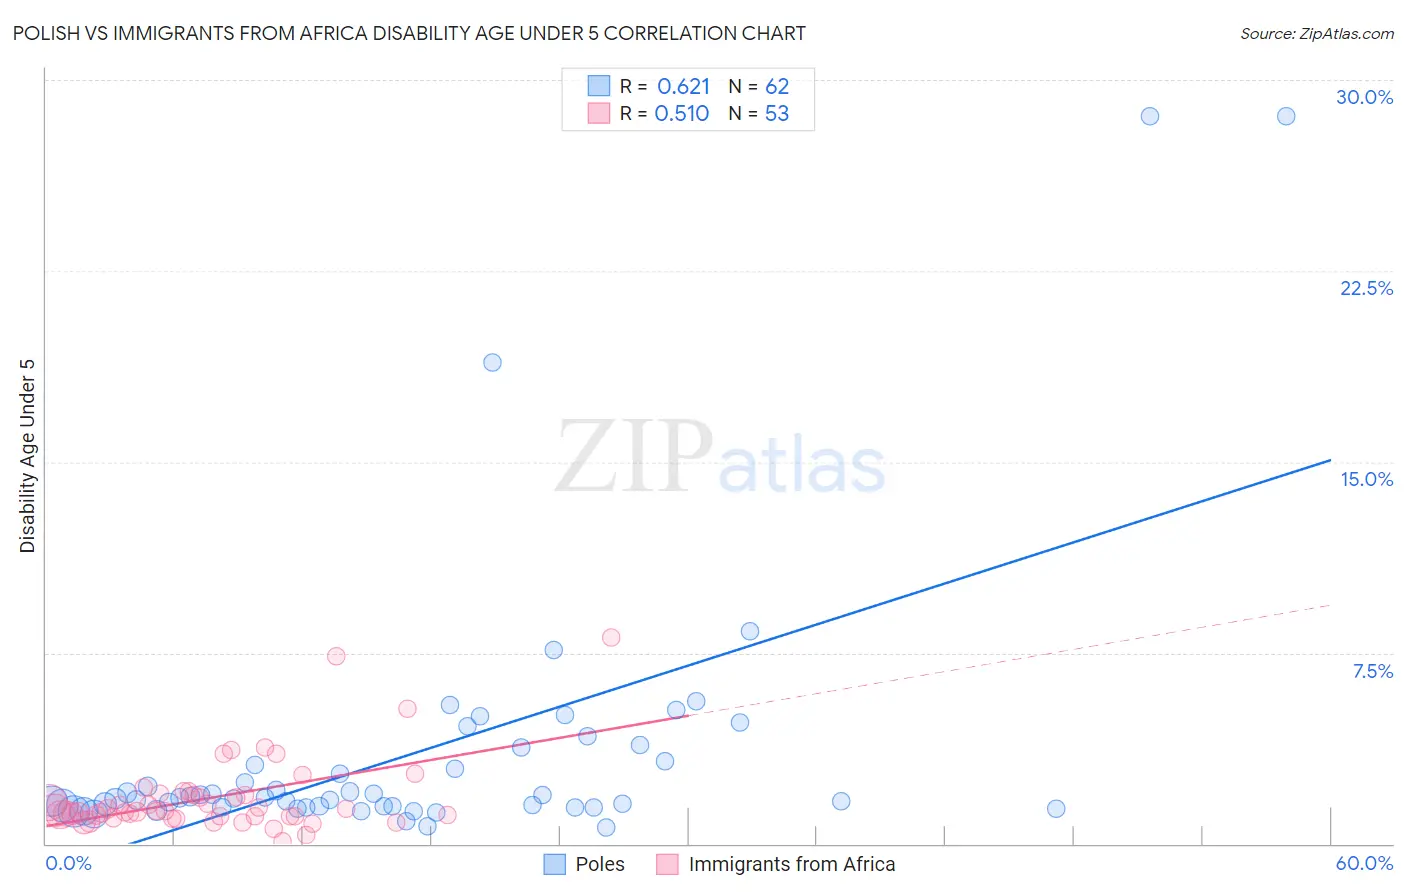
Polish vs Immigrants from Africa Disability Age Under 5 Correlation Chart
The statistical analysis conducted on geographies consisting of 257,764,935 people shows a significant positive correlation between the proportion of Poles and percentage of population with a disability under the age of 5 in the United States with a correlation coefficient (R) of 0.621 and weighted average of 1.6%. Similarly, the statistical analysis conducted on geographies consisting of 240,976,621 people shows a substantial positive correlation between the proportion of Immigrants from Africa and percentage of population with a disability under the age of 5 in the United States with a correlation coefficient (R) of 0.510 and weighted average of 1.2%, a difference of 30.1%.
Disability Age Under 5 Correlation Summary
| Measurement | Polish | Immigrants from Africa |
| Minimum | 0.65% | 0.10% |
| Maximum | 28.6% | 8.1% |
| Range | 27.9% | 8.0% |
| Mean | 3.5% | 1.8% |
| Median | 1.8% | 1.3% |
| Interquartile 25% (IQ1) | 1.4% | 1.1% |
| Interquartile 75% (IQ3) | 3.2% | 2.0% |
| Interquartile Range (IQR) | 1.8% | 0.89% |
| Standard Deviation (Sample) | 5.3% | 1.5% |
| Standard Deviation (Population) | 5.3% | 1.5% |
Similar Demographics by Disability Age Under 5
Demographics Similar to Poles by Disability Age Under 5
In terms of disability age under 5, the demographic groups most similar to Poles are Finnish (1.6%, a difference of 0.080%), Swedish (1.6%, a difference of 0.71%), Nonimmigrants (1.6%, a difference of 0.96%), Cajun (1.6%, a difference of 0.96%), and Portuguese (1.6%, a difference of 1.5%).
| Demographics | Rating | Rank | Disability Age Under 5 |
| Hungarians | 0.0 /100 | #289 | Tragic 1.5% |
| Czechs | 0.0 /100 | #290 | Tragic 1.5% |
| Northern Europeans | 0.0 /100 | #291 | Tragic 1.6% |
| Italians | 0.0 /100 | #292 | Tragic 1.6% |
| Lithuanians | 0.0 /100 | #293 | Tragic 1.6% |
| Swedes | 0.0 /100 | #294 | Tragic 1.6% |
| Finns | 0.0 /100 | #295 | Tragic 1.6% |
| Poles | 0.0 /100 | #296 | Tragic 1.6% |
| Immigrants | Nonimmigrants | 0.0 /100 | #297 | Tragic 1.6% |
| Cajuns | 0.0 /100 | #298 | Tragic 1.6% |
| Portuguese | 0.0 /100 | #299 | Tragic 1.6% |
| Shoshone | 0.0 /100 | #300 | Tragic 1.6% |
| German Russians | 0.0 /100 | #301 | Tragic 1.6% |
| Welsh | 0.0 /100 | #302 | Tragic 1.6% |
| Swiss | 0.0 /100 | #303 | Tragic 1.6% |
Demographics Similar to Immigrants from Africa by Disability Age Under 5
In terms of disability age under 5, the demographic groups most similar to Immigrants from Africa are Colombian (1.2%, a difference of 0.070%), Immigrants from Latin America (1.2%, a difference of 0.070%), Arab (1.2%, a difference of 0.13%), Guatemalan (1.2%, a difference of 0.15%), and Immigrants from South America (1.2%, a difference of 0.19%).
| Demographics | Rating | Rank | Disability Age Under 5 |
| Uruguayans | 68.8 /100 | #154 | Good 1.2% |
| Immigrants | Ghana | 68.7 /100 | #155 | Good 1.2% |
| Hawaiians | 68.5 /100 | #156 | Good 1.2% |
| Immigrants | South America | 67.0 /100 | #157 | Good 1.2% |
| Arabs | 66.4 /100 | #158 | Good 1.2% |
| Colombians | 65.8 /100 | #159 | Good 1.2% |
| Immigrants | Latin America | 65.8 /100 | #160 | Good 1.2% |
| Immigrants | Africa | 65.1 /100 | #161 | Good 1.2% |
| Guatemalans | 63.6 /100 | #162 | Good 1.2% |
| Immigrants | Guatemala | 63.2 /100 | #163 | Good 1.2% |
| Laotians | 62.8 /100 | #164 | Good 1.2% |
| Immigrants | Kuwait | 62.6 /100 | #165 | Good 1.2% |
| Immigrants | Central America | 61.4 /100 | #166 | Good 1.2% |
| Immigrants | Argentina | 60.2 /100 | #167 | Good 1.2% |
| Sierra Leoneans | 59.1 /100 | #168 | Average 1.2% |