Immigrants from Oceania vs Alaskan Athabascan Disability Age Under 5
COMPARE
Immigrants from Oceania
Alaskan Athabascan
Disability Age Under 5
Disability Age Under 5 Comparison
Immigrants from Oceania
Alaskan Athabascans
1.2%
DISABILITY AGE UNDER 5
94.2/ 100
METRIC RATING
113th/ 347
METRIC RANK
1.5%
DISABILITY AGE UNDER 5
0.1/ 100
METRIC RATING
273rd/ 347
METRIC RANK
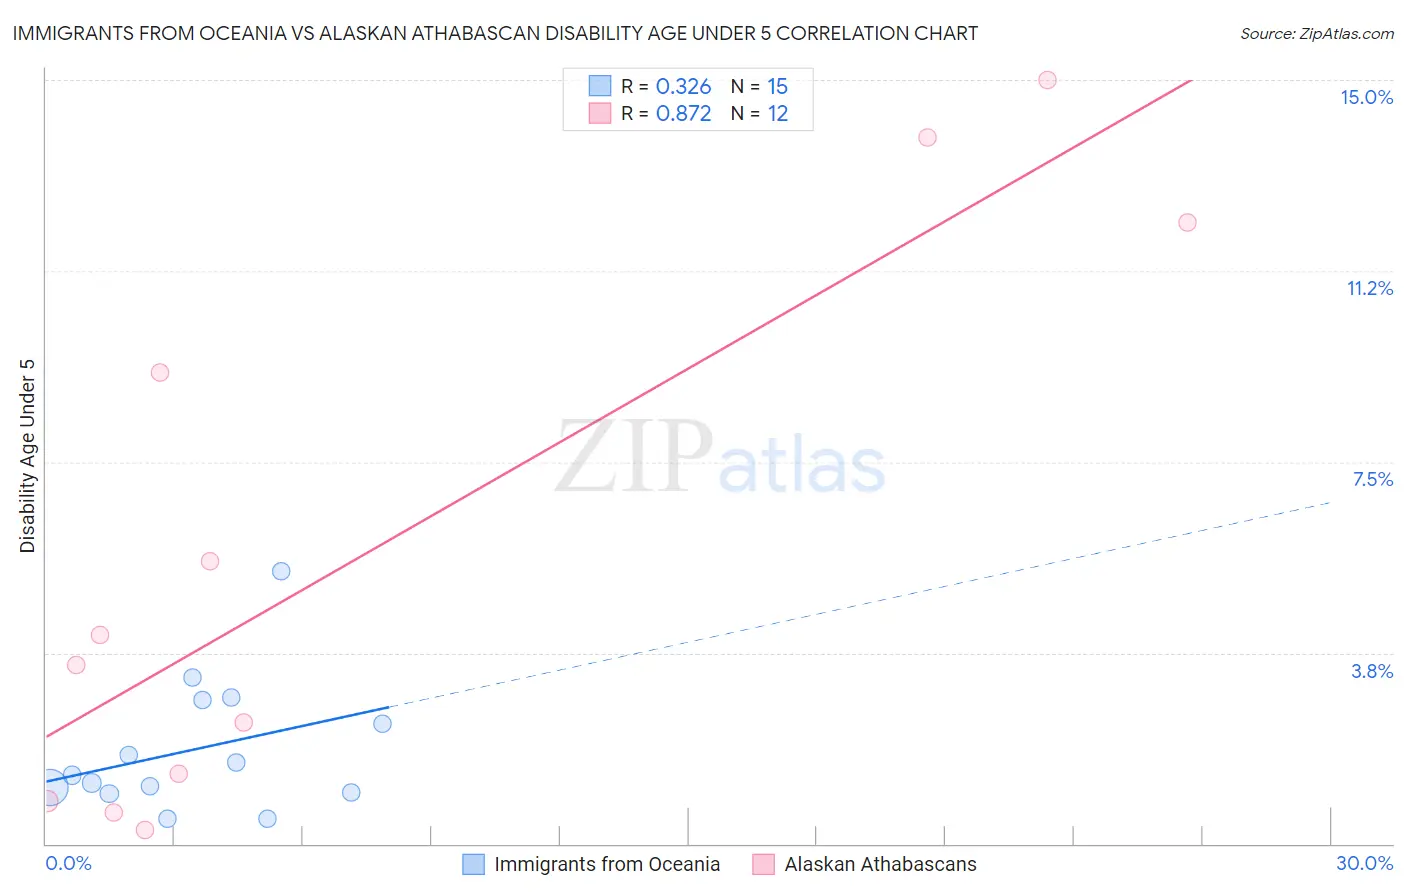
Immigrants from Oceania vs Alaskan Athabascan Disability Age Under 5 Correlation Chart
The statistical analysis conducted on geographies consisting of 180,365,611 people shows a mild positive correlation between the proportion of Immigrants from Oceania and percentage of population with a disability under the age of 5 in the United States with a correlation coefficient (R) of 0.326 and weighted average of 1.2%. Similarly, the statistical analysis conducted on geographies consisting of 36,074,143 people shows a very strong positive correlation between the proportion of Alaskan Athabascans and percentage of population with a disability under the age of 5 in the United States with a correlation coefficient (R) of 0.872 and weighted average of 1.5%, a difference of 24.9%.
Disability Age Under 5 Correlation Summary
| Measurement | Immigrants from Oceania | Alaskan Athabascan |
| Minimum | 0.49% | 0.26% |
| Maximum | 5.3% | 15.0% |
| Range | 4.9% | 14.7% |
| Mean | 1.9% | 5.7% |
| Median | 1.3% | 3.8% |
| Interquartile 25% (IQ1) | 1.0% | 1.1% |
| Interquartile 75% (IQ3) | 2.8% | 10.7% |
| Interquartile Range (IQR) | 1.8% | 9.6% |
| Standard Deviation (Sample) | 1.3% | 5.4% |
| Standard Deviation (Population) | 1.2% | 5.2% |
Similar Demographics by Disability Age Under 5
Demographics Similar to Immigrants from Oceania by Disability Age Under 5
In terms of disability age under 5, the demographic groups most similar to Immigrants from Oceania are Immigrants from Australia (1.2%, a difference of 0.060%), Belizean (1.2%, a difference of 0.15%), Immigrants from Caribbean (1.2%, a difference of 0.16%), Senegalese (1.2%, a difference of 0.17%), and Immigrants from Northern Africa (1.2%, a difference of 0.18%).
| Demographics | Rating | Rank | Disability Age Under 5 |
| Cambodians | 95.4 /100 | #106 | Exceptional 1.2% |
| Immigrants | West Indies | 95.3 /100 | #107 | Exceptional 1.2% |
| Iraqis | 95.1 /100 | #108 | Exceptional 1.2% |
| Immigrants | Panama | 95.0 /100 | #109 | Exceptional 1.2% |
| Immigrants | Lebanon | 95.0 /100 | #110 | Exceptional 1.2% |
| Senegalese | 94.6 /100 | #111 | Exceptional 1.2% |
| Immigrants | Australia | 94.4 /100 | #112 | Exceptional 1.2% |
| Immigrants | Oceania | 94.2 /100 | #113 | Exceptional 1.2% |
| Belizeans | 93.9 /100 | #114 | Exceptional 1.2% |
| Immigrants | Caribbean | 93.8 /100 | #115 | Exceptional 1.2% |
| Immigrants | Northern Africa | 93.8 /100 | #116 | Exceptional 1.2% |
| Immigrants | Philippines | 93.5 /100 | #117 | Exceptional 1.2% |
| Immigrants | Venezuela | 93.4 /100 | #118 | Exceptional 1.2% |
| Bhutanese | 92.5 /100 | #119 | Exceptional 1.2% |
| Immigrants | Eritrea | 92.3 /100 | #120 | Exceptional 1.2% |
Demographics Similar to Alaskan Athabascans by Disability Age Under 5
In terms of disability age under 5, the demographic groups most similar to Alaskan Athabascans are Iroquois (1.5%, a difference of 0.27%), Black/African American (1.4%, a difference of 0.29%), Brazilian (1.5%, a difference of 0.38%), Immigrants from Canada (1.4%, a difference of 0.46%), and Immigrants from North America (1.4%, a difference of 0.50%).
| Demographics | Rating | Rank | Disability Age Under 5 |
| Immigrants | Germany | 0.1 /100 | #266 | Tragic 1.4% |
| Cree | 0.1 /100 | #267 | Tragic 1.4% |
| Belgians | 0.1 /100 | #268 | Tragic 1.4% |
| Austrians | 0.1 /100 | #269 | Tragic 1.4% |
| Immigrants | North America | 0.1 /100 | #270 | Tragic 1.4% |
| Immigrants | Canada | 0.1 /100 | #271 | Tragic 1.4% |
| Blacks/African Americans | 0.1 /100 | #272 | Tragic 1.4% |
| Alaskan Athabascans | 0.1 /100 | #273 | Tragic 1.5% |
| Iroquois | 0.0 /100 | #274 | Tragic 1.5% |
| Brazilians | 0.0 /100 | #275 | Tragic 1.5% |
| Greeks | 0.0 /100 | #276 | Tragic 1.5% |
| Canadians | 0.0 /100 | #277 | Tragic 1.5% |
| Kiowa | 0.0 /100 | #278 | Tragic 1.5% |
| Danes | 0.0 /100 | #279 | Tragic 1.5% |
| British | 0.0 /100 | #280 | Tragic 1.5% |