U.S. Virgin Islander vs Alaskan Athabascan Disability Age Under 5
COMPARE
U.S. Virgin Islander
Alaskan Athabascan
Disability Age Under 5
Disability Age Under 5 Comparison
U.S. Virgin Islanders
Alaskan Athabascans
1.3%
DISABILITY AGE UNDER 5
34.4/ 100
METRIC RATING
195th/ 347
METRIC RANK
1.5%
DISABILITY AGE UNDER 5
0.1/ 100
METRIC RATING
273rd/ 347
METRIC RANK
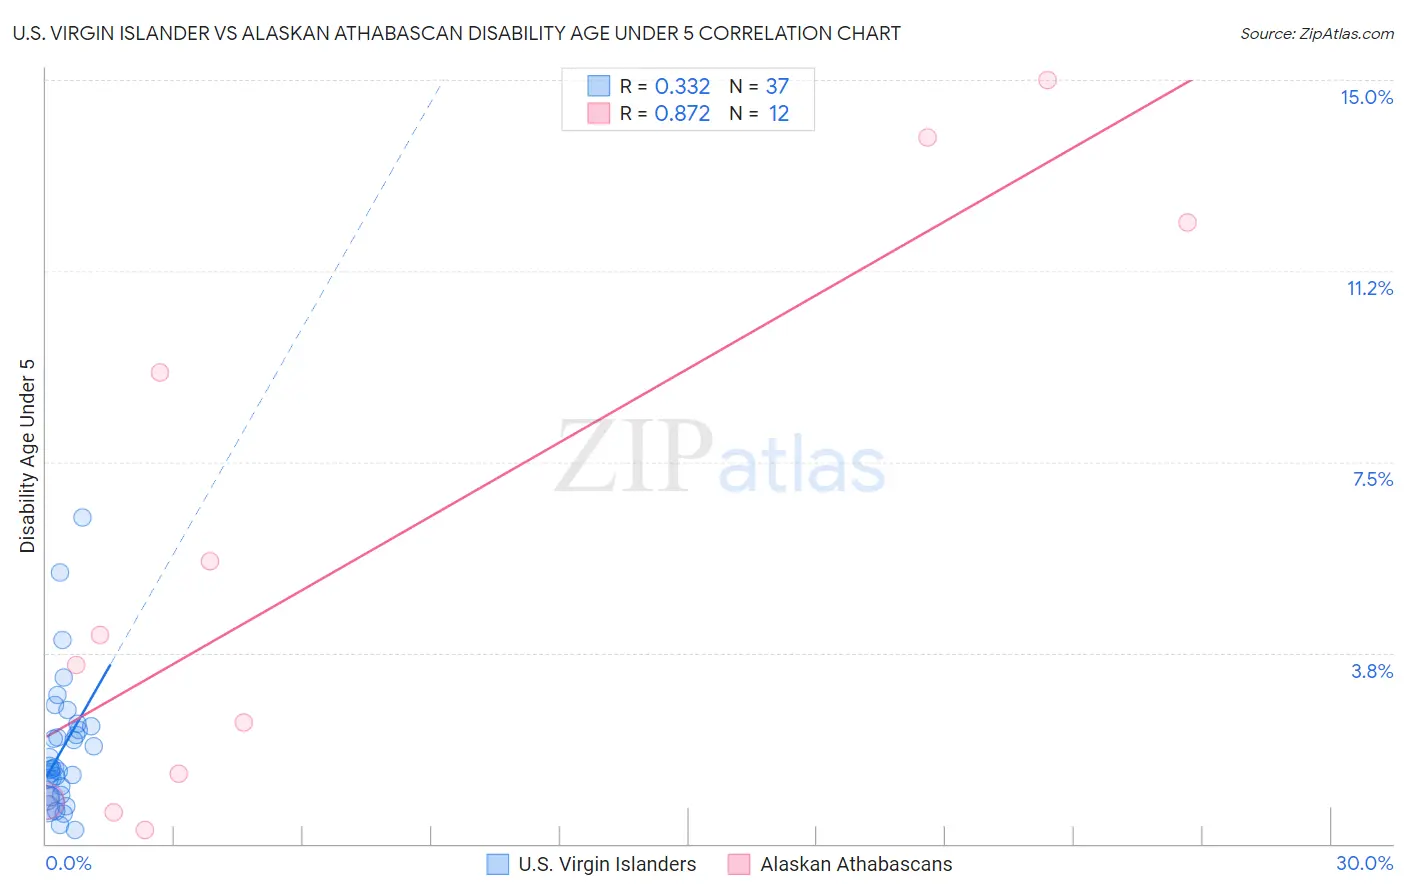
U.S. Virgin Islander vs Alaskan Athabascan Disability Age Under 5 Correlation Chart
The statistical analysis conducted on geographies consisting of 67,886,708 people shows a mild positive correlation between the proportion of U.S. Virgin Islanders and percentage of population with a disability under the age of 5 in the United States with a correlation coefficient (R) of 0.332 and weighted average of 1.3%. Similarly, the statistical analysis conducted on geographies consisting of 36,074,143 people shows a very strong positive correlation between the proportion of Alaskan Athabascans and percentage of population with a disability under the age of 5 in the United States with a correlation coefficient (R) of 0.872 and weighted average of 1.5%, a difference of 15.3%.
Disability Age Under 5 Correlation Summary
| Measurement | U.S. Virgin Islander | Alaskan Athabascan |
| Minimum | 0.26% | 0.26% |
| Maximum | 6.4% | 15.0% |
| Range | 6.1% | 14.7% |
| Mean | 1.8% | 5.7% |
| Median | 1.5% | 3.8% |
| Interquartile 25% (IQ1) | 0.94% | 1.1% |
| Interquartile 75% (IQ3) | 2.3% | 10.7% |
| Interquartile Range (IQR) | 1.3% | 9.6% |
| Standard Deviation (Sample) | 1.3% | 5.4% |
| Standard Deviation (Population) | 1.3% | 5.2% |
Similar Demographics by Disability Age Under 5
Demographics Similar to U.S. Virgin Islanders by Disability Age Under 5
In terms of disability age under 5, the demographic groups most similar to U.S. Virgin Islanders are Immigrants from North Macedonia (1.3%, a difference of 0.020%), Immigrants from Sierra Leone (1.3%, a difference of 0.20%), Mexican American Indian (1.3%, a difference of 0.21%), Immigrants from Bosnia and Herzegovina (1.3%, a difference of 0.21%), and Immigrants from Laos (1.3%, a difference of 0.22%).
| Demographics | Rating | Rank | Disability Age Under 5 |
| Haitians | 39.9 /100 | #188 | Fair 1.3% |
| Peruvians | 37.6 /100 | #189 | Fair 1.3% |
| Immigrants | Laos | 36.6 /100 | #190 | Fair 1.3% |
| Mexican American Indians | 36.6 /100 | #191 | Fair 1.3% |
| Immigrants | Bosnia and Herzegovina | 36.5 /100 | #192 | Fair 1.3% |
| Immigrants | Sierra Leone | 36.5 /100 | #193 | Fair 1.3% |
| Immigrants | North Macedonia | 34.7 /100 | #194 | Fair 1.3% |
| U.S. Virgin Islanders | 34.4 /100 | #195 | Fair 1.3% |
| Immigrants | Belgium | 31.4 /100 | #196 | Fair 1.3% |
| Immigrants | Somalia | 31.3 /100 | #197 | Fair 1.3% |
| Immigrants | Norway | 31.1 /100 | #198 | Fair 1.3% |
| Jamaicans | 30.7 /100 | #199 | Fair 1.3% |
| Immigrants | Lithuania | 27.2 /100 | #200 | Fair 1.3% |
| Immigrants | Italy | 25.4 /100 | #201 | Fair 1.3% |
| Arapaho | 24.1 /100 | #202 | Fair 1.3% |
Demographics Similar to Alaskan Athabascans by Disability Age Under 5
In terms of disability age under 5, the demographic groups most similar to Alaskan Athabascans are Iroquois (1.5%, a difference of 0.27%), Black/African American (1.4%, a difference of 0.29%), Brazilian (1.5%, a difference of 0.38%), Immigrants from Canada (1.4%, a difference of 0.46%), and Immigrants from North America (1.4%, a difference of 0.50%).
| Demographics | Rating | Rank | Disability Age Under 5 |
| Immigrants | Germany | 0.1 /100 | #266 | Tragic 1.4% |
| Cree | 0.1 /100 | #267 | Tragic 1.4% |
| Belgians | 0.1 /100 | #268 | Tragic 1.4% |
| Austrians | 0.1 /100 | #269 | Tragic 1.4% |
| Immigrants | North America | 0.1 /100 | #270 | Tragic 1.4% |
| Immigrants | Canada | 0.1 /100 | #271 | Tragic 1.4% |
| Blacks/African Americans | 0.1 /100 | #272 | Tragic 1.4% |
| Alaskan Athabascans | 0.1 /100 | #273 | Tragic 1.5% |
| Iroquois | 0.0 /100 | #274 | Tragic 1.5% |
| Brazilians | 0.0 /100 | #275 | Tragic 1.5% |
| Greeks | 0.0 /100 | #276 | Tragic 1.5% |
| Canadians | 0.0 /100 | #277 | Tragic 1.5% |
| Kiowa | 0.0 /100 | #278 | Tragic 1.5% |
| Danes | 0.0 /100 | #279 | Tragic 1.5% |
| British | 0.0 /100 | #280 | Tragic 1.5% |