Panamanian vs South African Male Disability
COMPARE
Panamanian
South African
Male Disability
Male Disability Comparison
Panamanians
South Africans
11.7%
MALE DISABILITY
3.8/ 100
METRIC RATING
219th/ 347
METRIC RANK
11.0%
MALE DISABILITY
81.7/ 100
METRIC RATING
139th/ 347
METRIC RANK
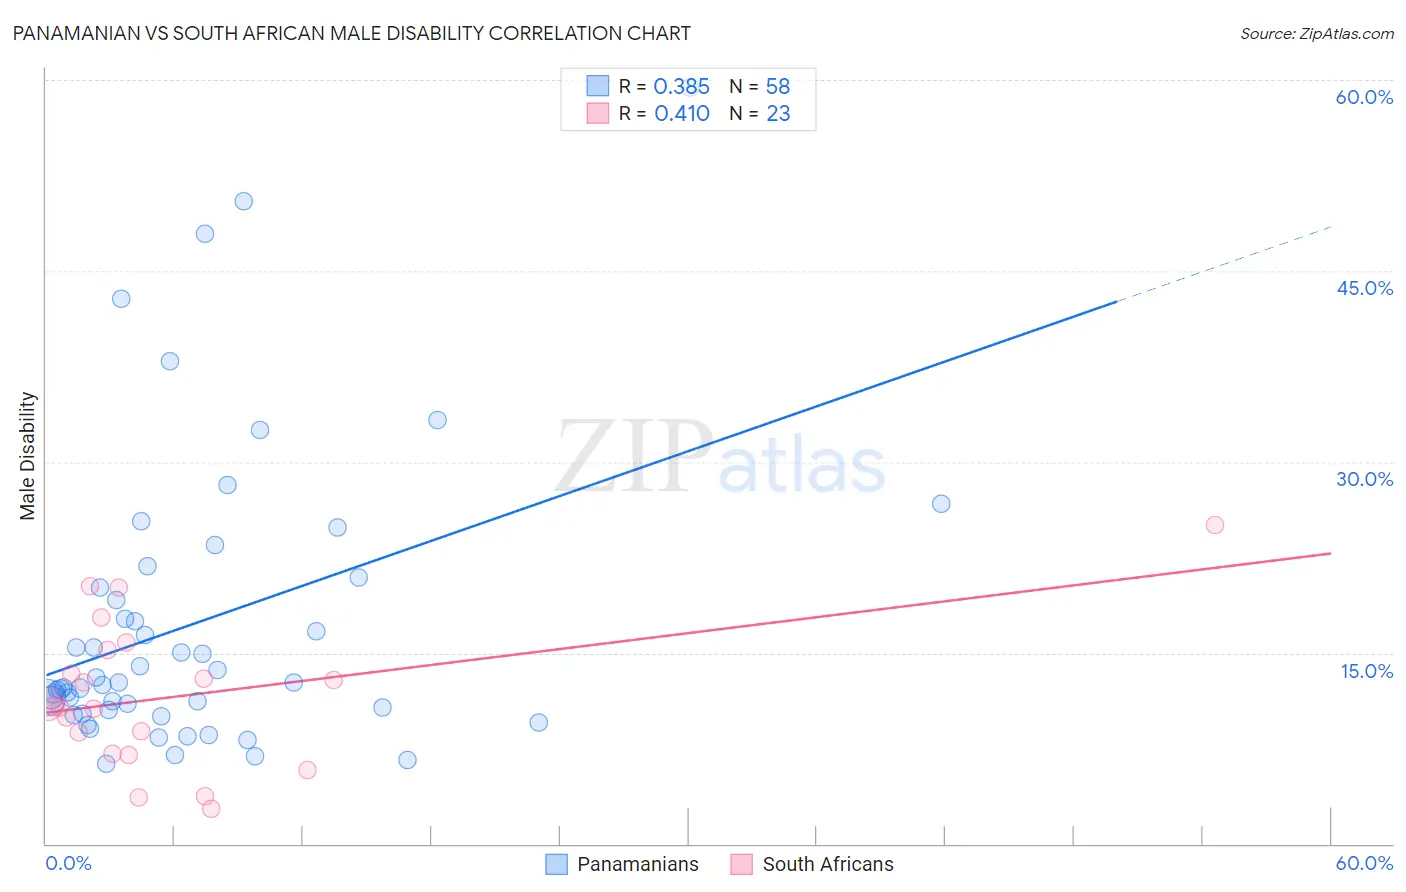
Panamanian vs South African Male Disability Correlation Chart
The statistical analysis conducted on geographies consisting of 281,191,975 people shows a mild positive correlation between the proportion of Panamanians and percentage of males with a disability in the United States with a correlation coefficient (R) of 0.385 and weighted average of 11.7%. Similarly, the statistical analysis conducted on geographies consisting of 182,590,861 people shows a moderate positive correlation between the proportion of South Africans and percentage of males with a disability in the United States with a correlation coefficient (R) of 0.410 and weighted average of 11.0%, a difference of 6.7%.
Male Disability Correlation Summary
| Measurement | Panamanian | South African |
| Minimum | 6.3% | 2.7% |
| Maximum | 59.5% | 25.0% |
| Range | 53.2% | 22.3% |
| Mean | 17.3% | 11.6% |
| Median | 12.6% | 10.8% |
| Interquartile 25% (IQ1) | 10.5% | 7.1% |
| Interquartile 75% (IQ3) | 20.1% | 15.2% |
| Interquartile Range (IQR) | 9.6% | 8.1% |
| Standard Deviation (Sample) | 11.5% | 5.7% |
| Standard Deviation (Population) | 11.4% | 5.5% |
Similar Demographics by Male Disability
Demographics Similar to Panamanians by Male Disability
In terms of male disability, the demographic groups most similar to Panamanians are Immigrants from Western Europe (11.7%, a difference of 0.010%), Immigrants from Congo (11.7%, a difference of 0.020%), Immigrants from England (11.7%, a difference of 0.060%), Alsatian (11.7%, a difference of 0.17%), and Immigrants from Bahamas (11.7%, a difference of 0.26%).
| Demographics | Rating | Rank | Male Disability |
| Immigrants | Scotland | 8.2 /100 | #212 | Tragic 11.6% |
| Mexican American Indians | 7.8 /100 | #213 | Tragic 11.6% |
| Lithuanians | 6.6 /100 | #214 | Tragic 11.6% |
| Indonesians | 5.9 /100 | #215 | Tragic 11.6% |
| Immigrants | Dominican Republic | 4.9 /100 | #216 | Tragic 11.7% |
| Immigrants | Dominica | 4.6 /100 | #217 | Tragic 11.7% |
| Immigrants | England | 4.0 /100 | #218 | Tragic 11.7% |
| Panamanians | 3.8 /100 | #219 | Tragic 11.7% |
| Immigrants | Western Europe | 3.8 /100 | #220 | Tragic 11.7% |
| Immigrants | Congo | 3.7 /100 | #221 | Tragic 11.7% |
| Alsatians | 3.3 /100 | #222 | Tragic 11.7% |
| Immigrants | Bahamas | 3.2 /100 | #223 | Tragic 11.7% |
| Japanese | 3.1 /100 | #224 | Tragic 11.7% |
| Liberians | 3.1 /100 | #225 | Tragic 11.8% |
| Sub-Saharan Africans | 2.8 /100 | #226 | Tragic 11.8% |
Demographics Similar to South Africans by Male Disability
In terms of male disability, the demographic groups most similar to South Africans are Nigerian (11.0%, a difference of 0.020%), Immigrants from Italy (11.0%, a difference of 0.020%), Arab (11.0%, a difference of 0.020%), Immigrants from Sudan (11.0%, a difference of 0.020%), and Immigrants from Europe (11.0%, a difference of 0.030%).
| Demographics | Rating | Rank | Male Disability |
| Immigrants | Fiji | 84.0 /100 | #132 | Excellent 11.0% |
| Ugandans | 83.9 /100 | #133 | Excellent 11.0% |
| Bhutanese | 83.4 /100 | #134 | Excellent 11.0% |
| Trinidadians and Tobagonians | 83.3 /100 | #135 | Excellent 11.0% |
| Immigrants | Costa Rica | 82.8 /100 | #136 | Excellent 11.0% |
| Immigrants | Europe | 82.0 /100 | #137 | Excellent 11.0% |
| Nigerians | 81.9 /100 | #138 | Excellent 11.0% |
| South Africans | 81.7 /100 | #139 | Excellent 11.0% |
| Immigrants | Italy | 81.5 /100 | #140 | Excellent 11.0% |
| Arabs | 81.5 /100 | #141 | Excellent 11.0% |
| Immigrants | Sudan | 81.5 /100 | #142 | Excellent 11.0% |
| Moroccans | 80.7 /100 | #143 | Excellent 11.0% |
| Kenyans | 78.1 /100 | #144 | Good 11.0% |
| Costa Ricans | 78.0 /100 | #145 | Good 11.0% |
| Koreans | 77.5 /100 | #146 | Good 11.0% |