Panamanian vs British 3 or more Vehicles in Household
COMPARE
Panamanian
British
3 or more Vehicles in Household
3 or more Vehicles in Household Comparison
Panamanians
British
18.8%
3 OR MORE VEHICLES IN HOUSEHOLD
11.6/ 100
METRIC RATING
212th/ 347
METRIC RANK
21.9%
3 OR MORE VEHICLES IN HOUSEHOLD
99.9/ 100
METRIC RATING
68th/ 347
METRIC RANK
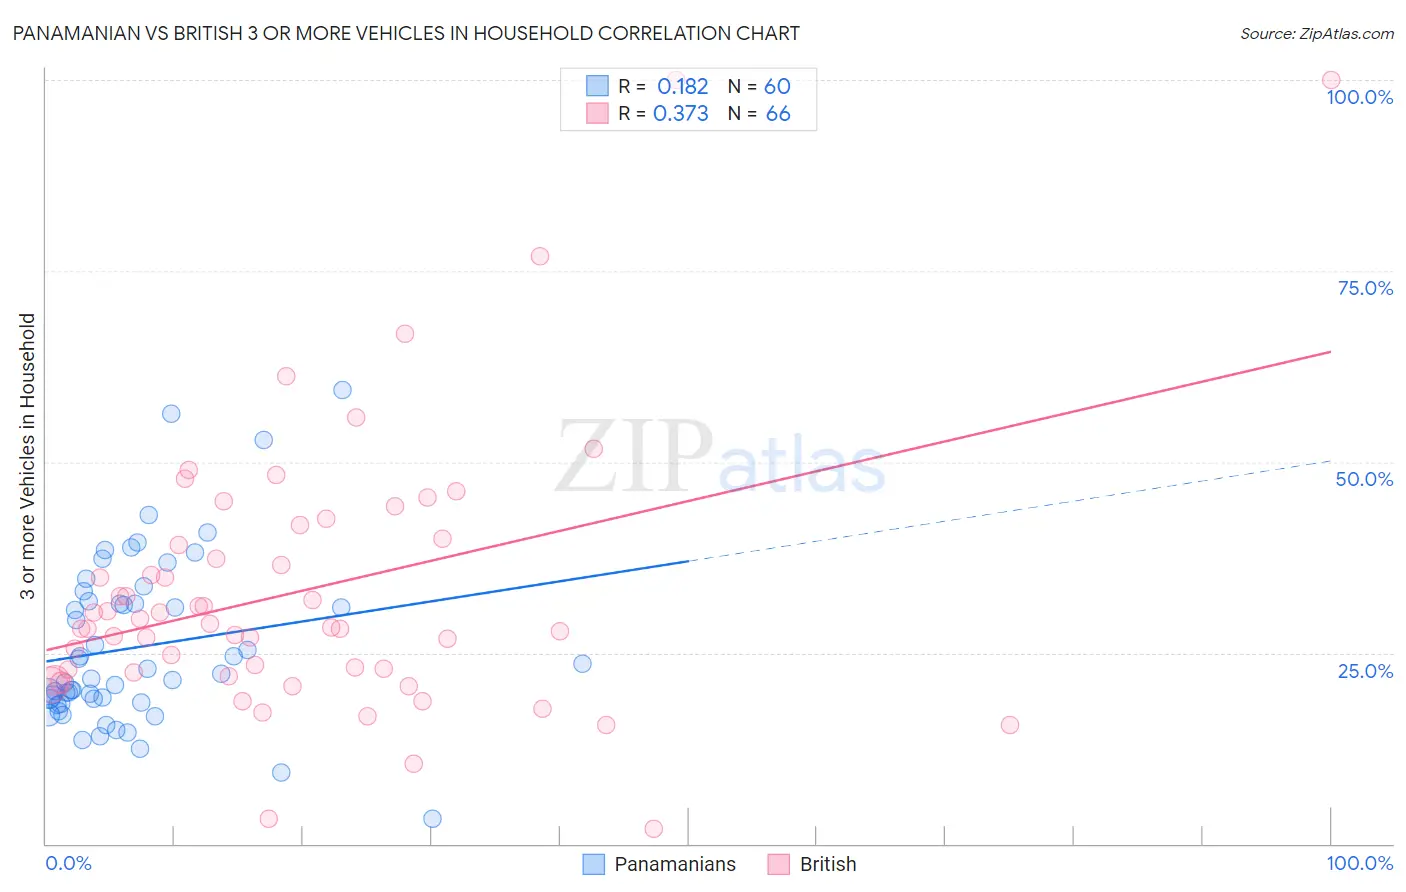
Panamanian vs British 3 or more Vehicles in Household Correlation Chart
The statistical analysis conducted on geographies consisting of 281,018,762 people shows a poor positive correlation between the proportion of Panamanians and percentage of households with 3 or more vehicles available in the United States with a correlation coefficient (R) of 0.182 and weighted average of 18.8%. Similarly, the statistical analysis conducted on geographies consisting of 530,803,931 people shows a mild positive correlation between the proportion of British and percentage of households with 3 or more vehicles available in the United States with a correlation coefficient (R) of 0.373 and weighted average of 21.9%, a difference of 16.9%.
3 or more Vehicles in Household Correlation Summary
| Measurement | Panamanian | British |
| Minimum | 3.2% | 1.9% |
| Maximum | 59.4% | 100.0% |
| Range | 56.1% | 98.1% |
| Mean | 25.7% | 33.2% |
| Median | 22.0% | 28.6% |
| Interquartile 25% (IQ1) | 18.7% | 22.5% |
| Interquartile 75% (IQ3) | 31.6% | 40.0% |
| Interquartile Range (IQR) | 12.9% | 17.5% |
| Standard Deviation (Sample) | 11.1% | 18.1% |
| Standard Deviation (Population) | 11.0% | 18.0% |
Similar Demographics by 3 or more Vehicles in Household
Demographics Similar to Panamanians by 3 or more Vehicles in Household
In terms of 3 or more vehicles in household, the demographic groups most similar to Panamanians are Immigrants from Cuba (18.8%, a difference of 0.010%), Immigrants from Kenya (18.8%, a difference of 0.14%), Immigrants from Sierra Leone (18.7%, a difference of 0.16%), Eastern European (18.7%, a difference of 0.21%), and Bulgarian (18.8%, a difference of 0.26%).
| Demographics | Rating | Rank | 3 or more Vehicles in Household |
| Russians | 14.2 /100 | #205 | Poor 18.8% |
| Immigrants | Eastern Asia | 14.1 /100 | #206 | Poor 18.8% |
| Immigrants | Chile | 13.6 /100 | #207 | Poor 18.8% |
| Immigrants | Burma/Myanmar | 13.6 /100 | #208 | Poor 18.8% |
| Immigrants | Egypt | 13.5 /100 | #209 | Poor 18.8% |
| Bulgarians | 13.1 /100 | #210 | Poor 18.8% |
| Immigrants | Kenya | 12.4 /100 | #211 | Poor 18.8% |
| Panamanians | 11.6 /100 | #212 | Poor 18.8% |
| Immigrants | Cuba | 11.6 /100 | #213 | Poor 18.8% |
| Immigrants | Sierra Leone | 10.8 /100 | #214 | Poor 18.7% |
| Eastern Europeans | 10.6 /100 | #215 | Poor 18.7% |
| Immigrants | Nigeria | 10.3 /100 | #216 | Poor 18.7% |
| Immigrants | Italy | 10.2 /100 | #217 | Poor 18.7% |
| Immigrants | Portugal | 8.9 /100 | #218 | Tragic 18.6% |
| Immigrants | Armenia | 8.6 /100 | #219 | Tragic 18.6% |
Demographics Similar to British by 3 or more Vehicles in Household
In terms of 3 or more vehicles in household, the demographic groups most similar to British are Creek (21.9%, a difference of 0.030%), Alaskan Athabascan (21.9%, a difference of 0.15%), Bangladeshi (21.9%, a difference of 0.22%), Potawatomi (21.9%, a difference of 0.23%), and Northern European (22.0%, a difference of 0.41%).
| Demographics | Rating | Rank | 3 or more Vehicles in Household |
| Bhutanese | 99.9 /100 | #61 | Exceptional 22.2% |
| Fijians | 99.9 /100 | #62 | Exceptional 22.2% |
| Chickasaw | 99.9 /100 | #63 | Exceptional 22.2% |
| Immigrants | Taiwan | 99.9 /100 | #64 | Exceptional 22.1% |
| Pima | 99.9 /100 | #65 | Exceptional 22.0% |
| Northern Europeans | 99.9 /100 | #66 | Exceptional 22.0% |
| Alaskan Athabascans | 99.9 /100 | #67 | Exceptional 21.9% |
| British | 99.9 /100 | #68 | Exceptional 21.9% |
| Creek | 99.9 /100 | #69 | Exceptional 21.9% |
| Bangladeshis | 99.8 /100 | #70 | Exceptional 21.9% |
| Potawatomi | 99.8 /100 | #71 | Exceptional 21.9% |
| Portuguese | 99.8 /100 | #72 | Exceptional 21.8% |
| Salvadorans | 99.8 /100 | #73 | Exceptional 21.8% |
| Immigrants | Oceania | 99.8 /100 | #74 | Exceptional 21.8% |
| Japanese | 99.8 /100 | #75 | Exceptional 21.8% |