Fijian vs Scandinavian Disability
COMPARE
Fijian
Scandinavian
Disability
Disability Comparison
Fijians
Scandinavians
12.8%
DISABILITY
0.0/ 100
METRIC RATING
279th/ 347
METRIC RANK
12.4%
DISABILITY
0.4/ 100
METRIC RATING
261st/ 347
METRIC RANK
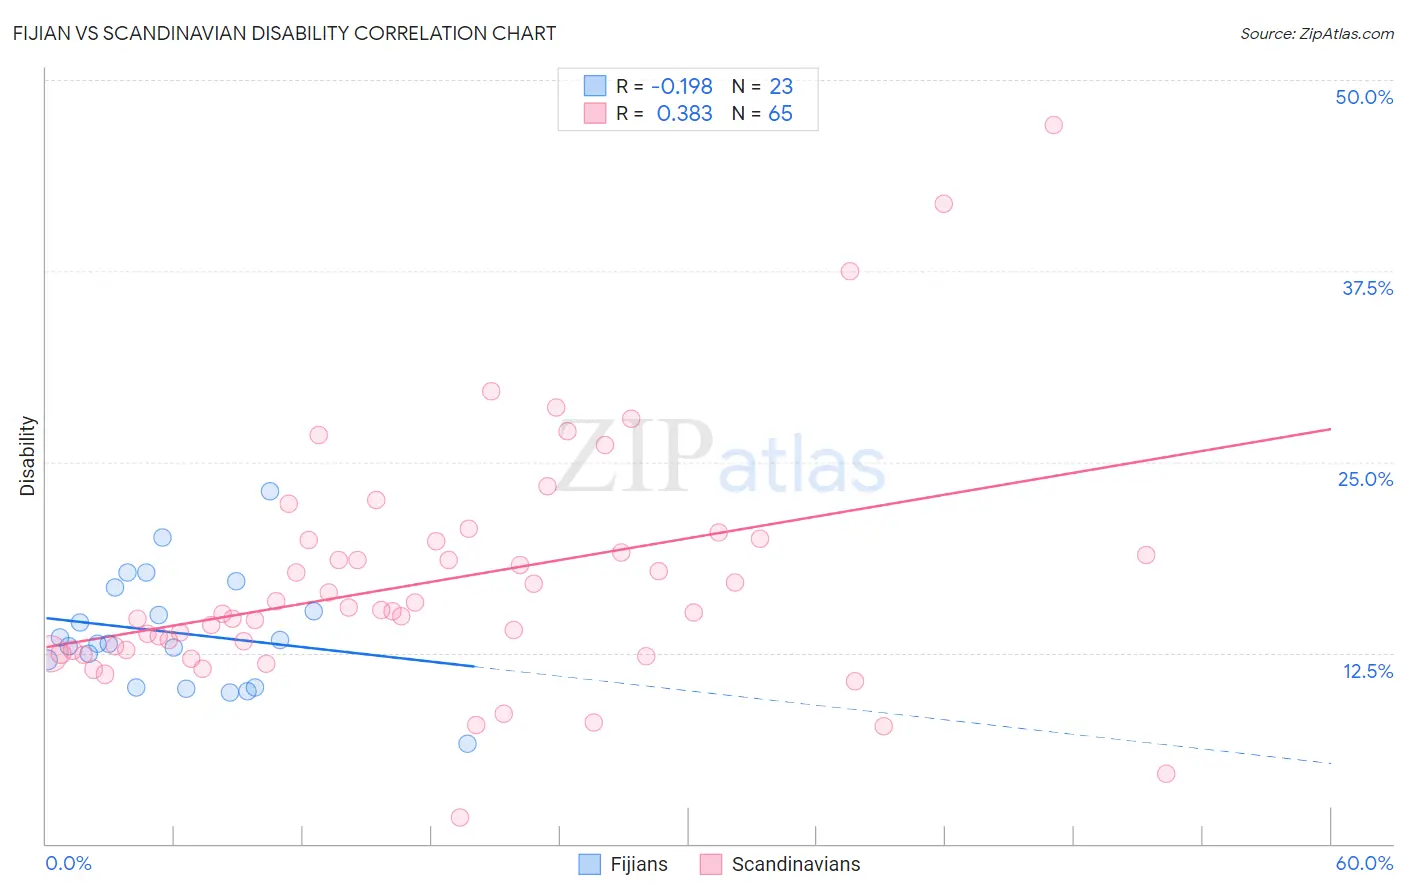
Fijian vs Scandinavian Disability Correlation Chart
The statistical analysis conducted on geographies consisting of 55,947,896 people shows a poor negative correlation between the proportion of Fijians and percentage of population with a disability in the United States with a correlation coefficient (R) of -0.198 and weighted average of 12.8%. Similarly, the statistical analysis conducted on geographies consisting of 472,547,672 people shows a mild positive correlation between the proportion of Scandinavians and percentage of population with a disability in the United States with a correlation coefficient (R) of 0.383 and weighted average of 12.4%, a difference of 3.4%.
Disability Correlation Summary
| Measurement | Fijian | Scandinavian |
| Minimum | 6.6% | 1.7% |
| Maximum | 23.1% | 47.1% |
| Range | 16.5% | 45.4% |
| Mean | 13.8% | 17.2% |
| Median | 13.1% | 15.2% |
| Interquartile 25% (IQ1) | 10.2% | 12.6% |
| Interquartile 75% (IQ3) | 16.8% | 19.9% |
| Interquartile Range (IQR) | 6.5% | 7.3% |
| Standard Deviation (Sample) | 3.7% | 7.9% |
| Standard Deviation (Population) | 3.7% | 7.8% |
Demographics Similar to Fijians and Scandinavians by Disability
In terms of disability, the demographic groups most similar to Fijians are Spanish (12.8%, a difference of 0.050%), German (12.8%, a difference of 0.090%), Dutch (12.8%, a difference of 0.26%), Hmong (12.8%, a difference of 0.31%), and Sioux (12.8%, a difference of 0.46%). Similarly, the demographic groups most similar to Scandinavians are Immigrants from Liberia (12.4%, a difference of 0.070%), Native Hawaiian (12.5%, a difference of 0.27%), Hawaiian (12.5%, a difference of 0.48%), Immigrants from Germany (12.5%, a difference of 0.59%), and U.S. Virgin Islander (12.5%, a difference of 0.61%).
| Demographics | Rating | Rank | Disability |
| Immigrants | Liberia | 0.4 /100 | #260 | Tragic 12.4% |
| Scandinavians | 0.4 /100 | #261 | Tragic 12.4% |
| Native Hawaiians | 0.3 /100 | #262 | Tragic 12.5% |
| Hawaiians | 0.2 /100 | #263 | Tragic 12.5% |
| Immigrants | Germany | 0.2 /100 | #264 | Tragic 12.5% |
| U.S. Virgin Islanders | 0.2 /100 | #265 | Tragic 12.5% |
| Czechoslovakians | 0.2 /100 | #266 | Tragic 12.5% |
| Spaniards | 0.2 /100 | #267 | Tragic 12.5% |
| Bangladeshis | 0.1 /100 | #268 | Tragic 12.6% |
| Immigrants | Dominican Republic | 0.1 /100 | #269 | Tragic 12.6% |
| Portuguese | 0.1 /100 | #270 | Tragic 12.6% |
| Immigrants | Yemen | 0.1 /100 | #271 | Tragic 12.6% |
| Dominicans | 0.0 /100 | #272 | Tragic 12.7% |
| Finns | 0.0 /100 | #273 | Tragic 12.7% |
| Nepalese | 0.0 /100 | #274 | Tragic 12.8% |
| Sioux | 0.0 /100 | #275 | Tragic 12.8% |
| Hmong | 0.0 /100 | #276 | Tragic 12.8% |
| Dutch | 0.0 /100 | #277 | Tragic 12.8% |
| Germans | 0.0 /100 | #278 | Tragic 12.8% |
| Fijians | 0.0 /100 | #279 | Tragic 12.8% |
| Spanish | 0.0 /100 | #280 | Tragic 12.8% |