Lumbee vs Scandinavian Disability
COMPARE
Lumbee
Scandinavian
Disability
Disability Comparison
Lumbee
Scandinavians
15.5%
DISABILITY
0.0/ 100
METRIC RATING
341st/ 347
METRIC RANK
12.4%
DISABILITY
0.4/ 100
METRIC RATING
261st/ 347
METRIC RANK
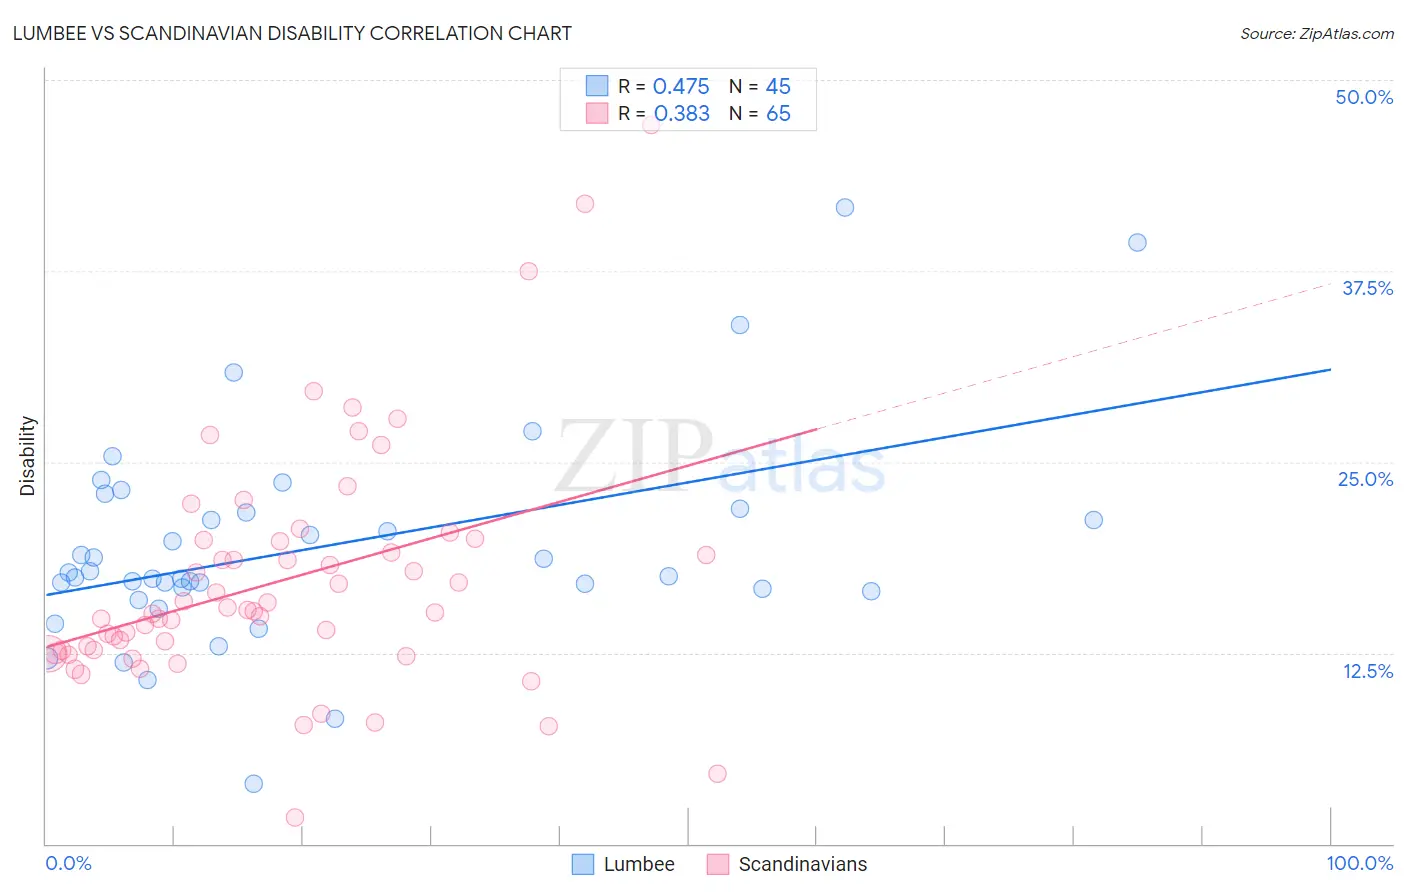
Lumbee vs Scandinavian Disability Correlation Chart
The statistical analysis conducted on geographies consisting of 92,289,178 people shows a moderate positive correlation between the proportion of Lumbee and percentage of population with a disability in the United States with a correlation coefficient (R) of 0.475 and weighted average of 15.5%. Similarly, the statistical analysis conducted on geographies consisting of 472,547,672 people shows a mild positive correlation between the proportion of Scandinavians and percentage of population with a disability in the United States with a correlation coefficient (R) of 0.383 and weighted average of 12.4%, a difference of 25.0%.
Disability Correlation Summary
| Measurement | Lumbee | Scandinavian |
| Minimum | 3.9% | 1.7% |
| Maximum | 41.7% | 47.1% |
| Range | 37.8% | 45.4% |
| Mean | 19.4% | 17.2% |
| Median | 17.5% | 15.2% |
| Interquartile 25% (IQ1) | 16.6% | 12.6% |
| Interquartile 75% (IQ3) | 21.8% | 19.9% |
| Interquartile Range (IQR) | 5.2% | 7.3% |
| Standard Deviation (Sample) | 7.0% | 7.9% |
| Standard Deviation (Population) | 6.9% | 7.8% |
Similar Demographics by Disability
Demographics Similar to Lumbee by Disability
In terms of disability, the demographic groups most similar to Lumbee are Kiowa (15.6%, a difference of 0.45%), Creek (15.6%, a difference of 0.47%), Choctaw (15.4%, a difference of 0.84%), Colville (15.8%, a difference of 1.7%), and Chickasaw (15.2%, a difference of 2.3%).
| Demographics | Rating | Rank | Disability |
| Cajuns | 0.0 /100 | #333 | Tragic 14.6% |
| Yuman | 0.0 /100 | #334 | Tragic 14.6% |
| Tohono O'odham | 0.0 /100 | #335 | Tragic 14.8% |
| Cherokee | 0.0 /100 | #336 | Tragic 14.8% |
| Seminole | 0.0 /100 | #337 | Tragic 14.9% |
| Dutch West Indians | 0.0 /100 | #338 | Tragic 14.9% |
| Chickasaw | 0.0 /100 | #339 | Tragic 15.2% |
| Choctaw | 0.0 /100 | #340 | Tragic 15.4% |
| Lumbee | 0.0 /100 | #341 | Tragic 15.5% |
| Kiowa | 0.0 /100 | #342 | Tragic 15.6% |
| Creek | 0.0 /100 | #343 | Tragic 15.6% |
| Colville | 0.0 /100 | #344 | Tragic 15.8% |
| Puerto Ricans | 0.0 /100 | #345 | Tragic 16.1% |
| Tsimshian | 0.0 /100 | #346 | Tragic 16.1% |
| Houma | 0.0 /100 | #347 | Tragic 17.1% |
Demographics Similar to Scandinavians by Disability
In terms of disability, the demographic groups most similar to Scandinavians are Immigrants from Liberia (12.4%, a difference of 0.070%), Canadian (12.4%, a difference of 0.10%), Slavic (12.4%, a difference of 0.16%), Native Hawaiian (12.5%, a difference of 0.27%), and Immigrants from Laos (12.4%, a difference of 0.30%).
| Demographics | Rating | Rank | Disability |
| German Russians | 0.8 /100 | #254 | Tragic 12.3% |
| Slovenes | 0.6 /100 | #255 | Tragic 12.4% |
| Immigrants | Dominica | 0.6 /100 | #256 | Tragic 12.4% |
| Immigrants | Laos | 0.5 /100 | #257 | Tragic 12.4% |
| Slavs | 0.5 /100 | #258 | Tragic 12.4% |
| Canadians | 0.4 /100 | #259 | Tragic 12.4% |
| Immigrants | Liberia | 0.4 /100 | #260 | Tragic 12.4% |
| Scandinavians | 0.4 /100 | #261 | Tragic 12.4% |
| Native Hawaiians | 0.3 /100 | #262 | Tragic 12.5% |
| Hawaiians | 0.2 /100 | #263 | Tragic 12.5% |
| Immigrants | Germany | 0.2 /100 | #264 | Tragic 12.5% |
| U.S. Virgin Islanders | 0.2 /100 | #265 | Tragic 12.5% |
| Czechoslovakians | 0.2 /100 | #266 | Tragic 12.5% |
| Spaniards | 0.2 /100 | #267 | Tragic 12.5% |
| Bangladeshis | 0.1 /100 | #268 | Tragic 12.6% |