Palestinian vs Scandinavian Hearing Disability
COMPARE
Palestinian
Scandinavian
Hearing Disability
Hearing Disability Comparison
Palestinians
Scandinavians
2.9%
HEARING DISABILITY
73.6/ 100
METRIC RATING
150th/ 347
METRIC RANK
3.6%
HEARING DISABILITY
0.0/ 100
METRIC RATING
281st/ 347
METRIC RANK
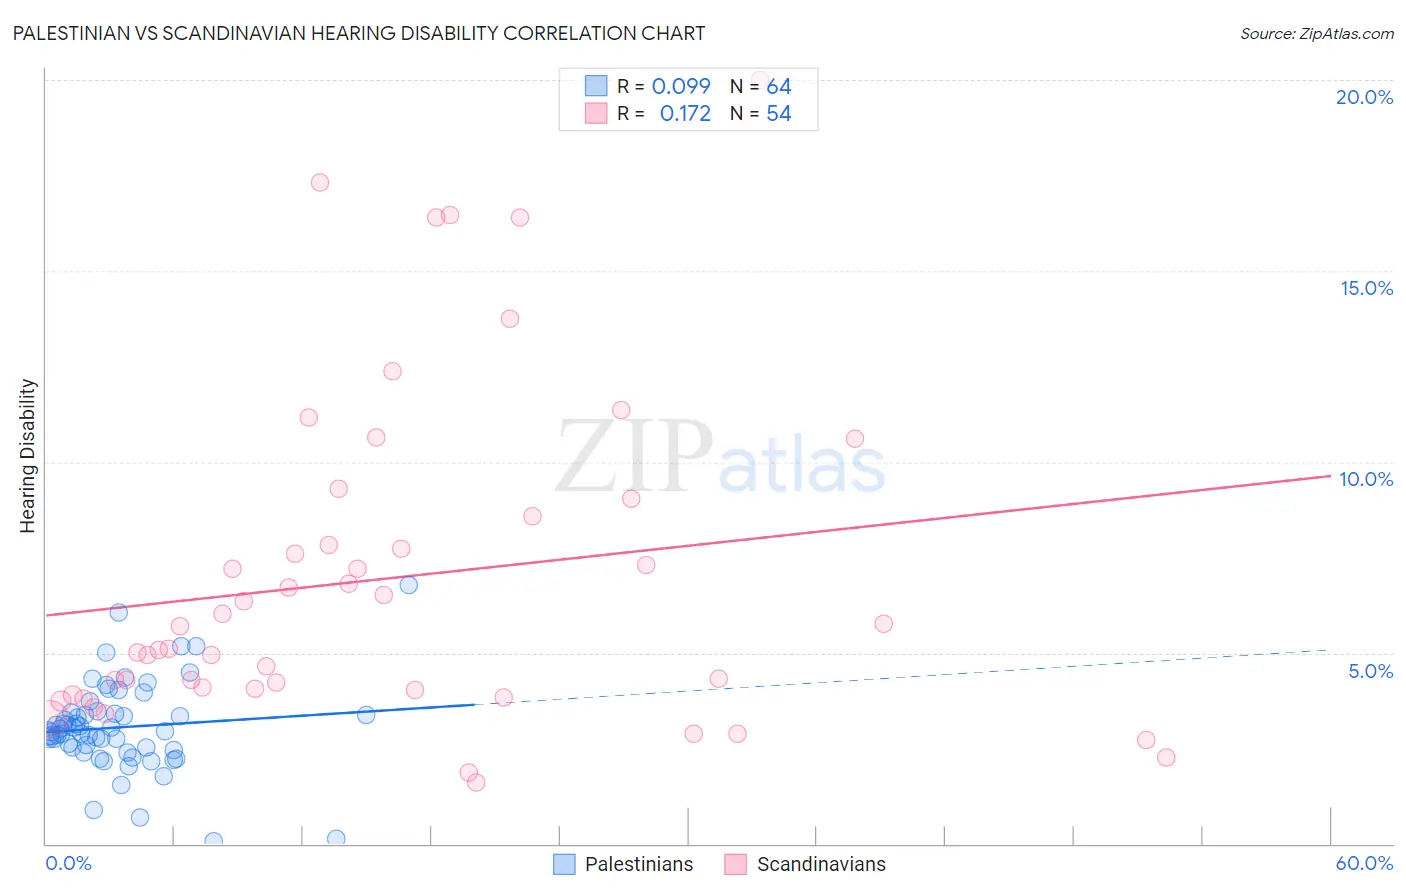
Palestinian vs Scandinavian Hearing Disability Correlation Chart
The statistical analysis conducted on geographies consisting of 216,454,064 people shows a slight positive correlation between the proportion of Palestinians and percentage of population with hearing disability in the United States with a correlation coefficient (R) of 0.099 and weighted average of 2.9%. Similarly, the statistical analysis conducted on geographies consisting of 472,380,661 people shows a poor positive correlation between the proportion of Scandinavians and percentage of population with hearing disability in the United States with a correlation coefficient (R) of 0.172 and weighted average of 3.6%, a difference of 23.4%.
Hearing Disability Correlation Summary
| Measurement | Palestinian | Scandinavian |
| Minimum | 0.070% | 1.6% |
| Maximum | 6.8% | 20.0% |
| Range | 6.7% | 18.4% |
| Mean | 3.0% | 6.9% |
| Median | 2.9% | 5.4% |
| Interquartile 25% (IQ1) | 2.5% | 4.0% |
| Interquartile 75% (IQ3) | 3.4% | 8.6% |
| Interquartile Range (IQR) | 0.93% | 4.6% |
| Standard Deviation (Sample) | 1.2% | 4.3% |
| Standard Deviation (Population) | 1.2% | 4.3% |
Similar Demographics by Hearing Disability
Demographics Similar to Palestinians by Hearing Disability
In terms of hearing disability, the demographic groups most similar to Palestinians are Immigrants from France (2.9%, a difference of 0.060%), Immigrants from Lithuania (2.9%, a difference of 0.070%), Sudanese (2.9%, a difference of 0.18%), Immigrants from Lebanon (2.9%, a difference of 0.25%), and Costa Rican (2.9%, a difference of 0.27%).
| Demographics | Rating | Rank | Hearing Disability |
| Immigrants | Bahamas | 80.9 /100 | #143 | Excellent 2.9% |
| Immigrants | Bulgaria | 79.2 /100 | #144 | Good 2.9% |
| Immigrants | Congo | 78.9 /100 | #145 | Good 2.9% |
| Brazilians | 78.7 /100 | #146 | Good 2.9% |
| Tongans | 78.6 /100 | #147 | Good 2.9% |
| Immigrants | Russia | 77.7 /100 | #148 | Good 2.9% |
| Immigrants | Panama | 76.9 /100 | #149 | Good 2.9% |
| Palestinians | 73.6 /100 | #150 | Good 2.9% |
| Immigrants | France | 73.1 /100 | #151 | Good 2.9% |
| Immigrants | Lithuania | 73.0 /100 | #152 | Good 2.9% |
| Sudanese | 72.1 /100 | #153 | Good 2.9% |
| Immigrants | Lebanon | 71.5 /100 | #154 | Good 2.9% |
| Costa Ricans | 71.4 /100 | #155 | Good 2.9% |
| Immigrants | Poland | 70.2 /100 | #156 | Good 2.9% |
| Immigrants | Kazakhstan | 69.6 /100 | #157 | Good 2.9% |
Demographics Similar to Scandinavians by Hearing Disability
In terms of hearing disability, the demographic groups most similar to Scandinavians are French American Indian (3.6%, a difference of 0.060%), Swedish (3.6%, a difference of 0.090%), Slovak (3.6%, a difference of 0.12%), Blackfeet (3.6%, a difference of 0.34%), and Basque (3.6%, a difference of 0.39%).
| Demographics | Rating | Rank | Hearing Disability |
| Swiss | 0.0 /100 | #274 | Tragic 3.5% |
| Czechoslovakians | 0.0 /100 | #275 | Tragic 3.6% |
| Danes | 0.0 /100 | #276 | Tragic 3.6% |
| Immigrants | Nonimmigrants | 0.0 /100 | #277 | Tragic 3.6% |
| Basques | 0.0 /100 | #278 | Tragic 3.6% |
| Slovaks | 0.0 /100 | #279 | Tragic 3.6% |
| French American Indians | 0.0 /100 | #280 | Tragic 3.6% |
| Scandinavians | 0.0 /100 | #281 | Tragic 3.6% |
| Swedes | 0.0 /100 | #282 | Tragic 3.6% |
| Blackfeet | 0.0 /100 | #283 | Tragic 3.6% |
| Immigrants | Micronesia | 0.0 /100 | #284 | Tragic 3.6% |
| Sioux | 0.0 /100 | #285 | Tragic 3.6% |
| Delaware | 0.0 /100 | #286 | Tragic 3.6% |
| Spanish | 0.0 /100 | #287 | Tragic 3.7% |
| Irish | 0.0 /100 | #288 | Tragic 3.7% |