Immigrants from Pakistan vs Scandinavian Disability
COMPARE
Immigrants from Pakistan
Scandinavian
Disability
Disability Comparison
Immigrants from Pakistan
Scandinavians
10.4%
DISABILITY
100.0/ 100
METRIC RATING
19th/ 347
METRIC RANK
12.4%
DISABILITY
0.4/ 100
METRIC RATING
261st/ 347
METRIC RANK
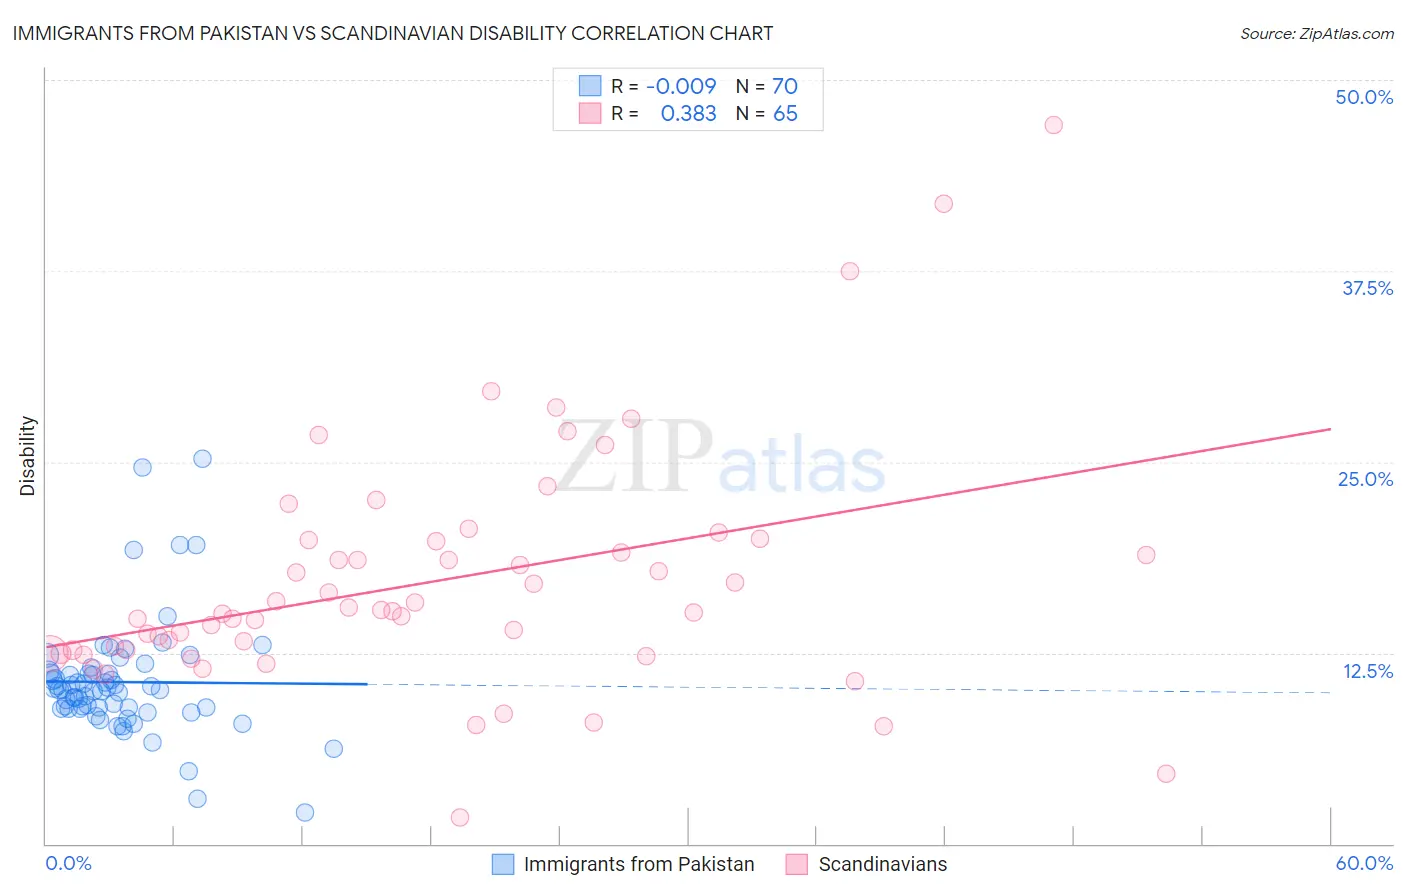
Immigrants from Pakistan vs Scandinavian Disability Correlation Chart
The statistical analysis conducted on geographies consisting of 283,903,019 people shows no correlation between the proportion of Immigrants from Pakistan and percentage of population with a disability in the United States with a correlation coefficient (R) of -0.009 and weighted average of 10.4%. Similarly, the statistical analysis conducted on geographies consisting of 472,547,672 people shows a mild positive correlation between the proportion of Scandinavians and percentage of population with a disability in the United States with a correlation coefficient (R) of 0.383 and weighted average of 12.4%, a difference of 19.8%.
Disability Correlation Summary
| Measurement | Immigrants from Pakistan | Scandinavian |
| Minimum | 2.0% | 1.7% |
| Maximum | 25.2% | 47.1% |
| Range | 23.2% | 45.4% |
| Mean | 10.6% | 17.2% |
| Median | 10.1% | 15.2% |
| Interquartile 25% (IQ1) | 8.9% | 12.6% |
| Interquartile 75% (IQ3) | 11.2% | 19.9% |
| Interquartile Range (IQR) | 2.3% | 7.3% |
| Standard Deviation (Sample) | 3.8% | 7.9% |
| Standard Deviation (Population) | 3.8% | 7.8% |
Similar Demographics by Disability
Demographics Similar to Immigrants from Pakistan by Disability
In terms of disability, the demographic groups most similar to Immigrants from Pakistan are Burmese (10.4%, a difference of 0.010%), Immigrants from Venezuela (10.4%, a difference of 0.69%), Asian (10.4%, a difference of 0.72%), Immigrants from Sri Lanka (10.5%, a difference of 0.82%), and Immigrants from Iran (10.3%, a difference of 0.99%).
| Demographics | Rating | Rank | Disability |
| Immigrants | Israel | 100.0 /100 | #12 | Exceptional 10.1% |
| Immigrants | Eastern Asia | 100.0 /100 | #13 | Exceptional 10.2% |
| Immigrants | Korea | 100.0 /100 | #14 | Exceptional 10.2% |
| Okinawans | 100.0 /100 | #15 | Exceptional 10.3% |
| Indians (Asian) | 100.0 /100 | #16 | Exceptional 10.3% |
| Immigrants | Iran | 100.0 /100 | #17 | Exceptional 10.3% |
| Burmese | 100.0 /100 | #18 | Exceptional 10.4% |
| Immigrants | Pakistan | 100.0 /100 | #19 | Exceptional 10.4% |
| Immigrants | Venezuela | 100.0 /100 | #20 | Exceptional 10.4% |
| Asians | 100.0 /100 | #21 | Exceptional 10.4% |
| Immigrants | Sri Lanka | 100.0 /100 | #22 | Exceptional 10.5% |
| Immigrants | Asia | 100.0 /100 | #23 | Exceptional 10.5% |
| Venezuelans | 100.0 /100 | #24 | Exceptional 10.5% |
| Immigrants | Malaysia | 100.0 /100 | #25 | Exceptional 10.6% |
| Argentineans | 100.0 /100 | #26 | Exceptional 10.6% |
Demographics Similar to Scandinavians by Disability
In terms of disability, the demographic groups most similar to Scandinavians are Immigrants from Liberia (12.4%, a difference of 0.070%), Canadian (12.4%, a difference of 0.10%), Slavic (12.4%, a difference of 0.16%), Native Hawaiian (12.5%, a difference of 0.27%), and Immigrants from Laos (12.4%, a difference of 0.30%).
| Demographics | Rating | Rank | Disability |
| German Russians | 0.8 /100 | #254 | Tragic 12.3% |
| Slovenes | 0.6 /100 | #255 | Tragic 12.4% |
| Immigrants | Dominica | 0.6 /100 | #256 | Tragic 12.4% |
| Immigrants | Laos | 0.5 /100 | #257 | Tragic 12.4% |
| Slavs | 0.5 /100 | #258 | Tragic 12.4% |
| Canadians | 0.4 /100 | #259 | Tragic 12.4% |
| Immigrants | Liberia | 0.4 /100 | #260 | Tragic 12.4% |
| Scandinavians | 0.4 /100 | #261 | Tragic 12.4% |
| Native Hawaiians | 0.3 /100 | #262 | Tragic 12.5% |
| Hawaiians | 0.2 /100 | #263 | Tragic 12.5% |
| Immigrants | Germany | 0.2 /100 | #264 | Tragic 12.5% |
| U.S. Virgin Islanders | 0.2 /100 | #265 | Tragic 12.5% |
| Czechoslovakians | 0.2 /100 | #266 | Tragic 12.5% |
| Spaniards | 0.2 /100 | #267 | Tragic 12.5% |
| Bangladeshis | 0.1 /100 | #268 | Tragic 12.6% |