Immigrants from Trinidad and Tobago vs Moroccan Disability
COMPARE
Immigrants from Trinidad and Tobago
Moroccan
Disability
Disability Comparison
Immigrants from Trinidad and Tobago
Moroccans
11.7%
DISABILITY
58.9/ 100
METRIC RATING
163rd/ 347
METRIC RANK
11.5%
DISABILITY
83.3/ 100
METRIC RATING
143rd/ 347
METRIC RANK
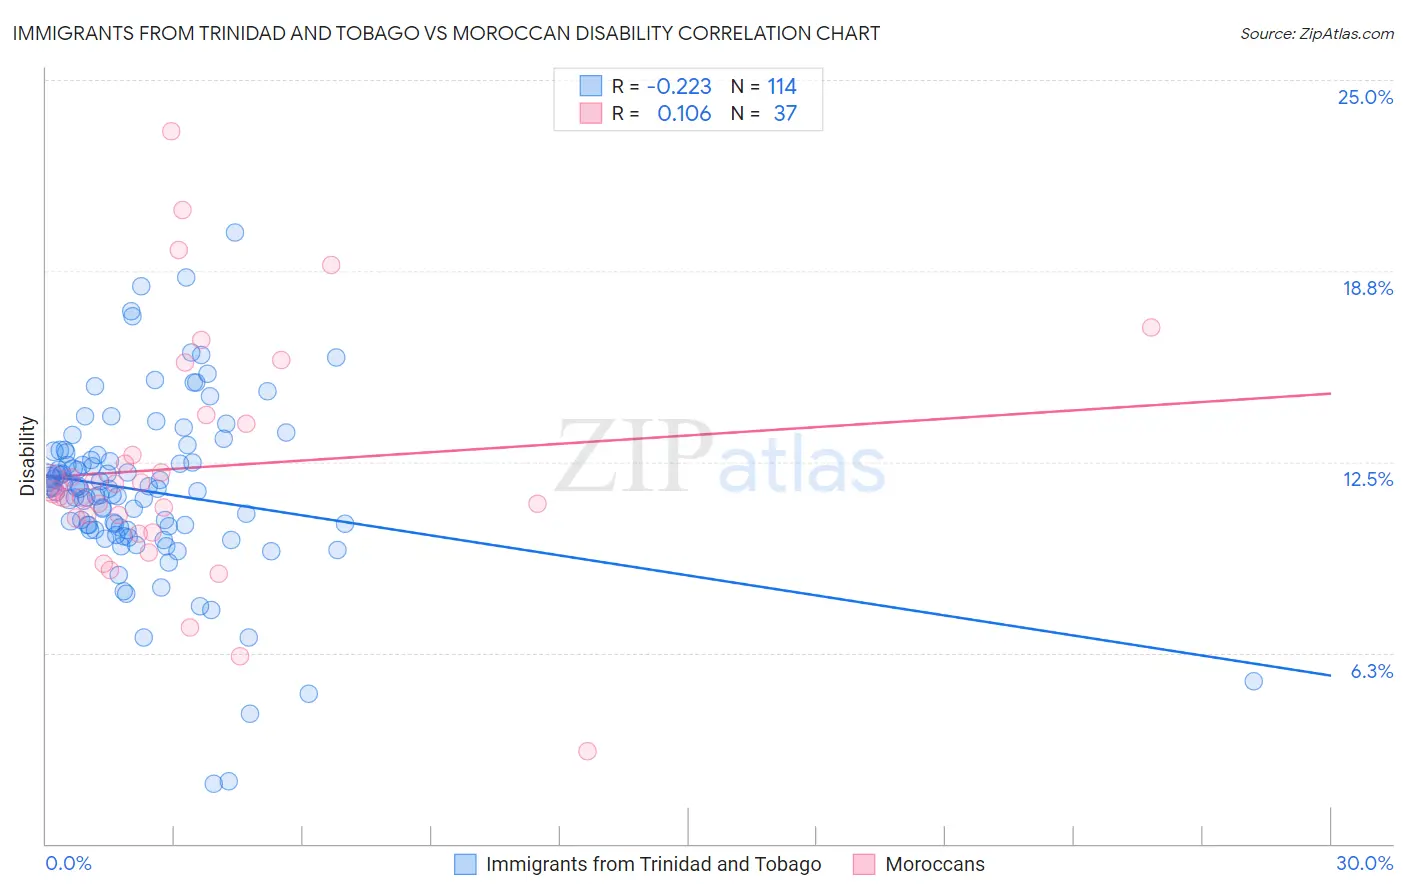
Immigrants from Trinidad and Tobago vs Moroccan Disability Correlation Chart
The statistical analysis conducted on geographies consisting of 223,506,024 people shows a weak negative correlation between the proportion of Immigrants from Trinidad and Tobago and percentage of population with a disability in the United States with a correlation coefficient (R) of -0.223 and weighted average of 11.7%. Similarly, the statistical analysis conducted on geographies consisting of 201,799,768 people shows a poor positive correlation between the proportion of Moroccans and percentage of population with a disability in the United States with a correlation coefficient (R) of 0.106 and weighted average of 11.5%, a difference of 1.4%.
Disability Correlation Summary
| Measurement | Immigrants from Trinidad and Tobago | Moroccan |
| Minimum | 2.0% | 3.0% |
| Maximum | 20.0% | 23.3% |
| Range | 18.0% | 20.3% |
| Mean | 11.5% | 12.3% |
| Median | 11.6% | 11.5% |
| Interquartile 25% (IQ1) | 10.3% | 10.4% |
| Interquartile 75% (IQ3) | 12.7% | 13.9% |
| Interquartile Range (IQR) | 2.5% | 3.5% |
| Standard Deviation (Sample) | 2.9% | 4.0% |
| Standard Deviation (Population) | 2.9% | 3.9% |
Demographics Similar to Immigrants from Trinidad and Tobago and Moroccans by Disability
In terms of disability, the demographic groups most similar to Immigrants from Trinidad and Tobago are Immigrants from Haiti (11.7%, a difference of 0.020%), Immigrants from Cuba (11.6%, a difference of 0.19%), Immigrants from Barbados (11.6%, a difference of 0.25%), Guatemalan (11.6%, a difference of 0.29%), and Armenian (11.6%, a difference of 0.33%). Similarly, the demographic groups most similar to Moroccans are Australian (11.5%, a difference of 0.070%), Nigerian (11.5%, a difference of 0.15%), Immigrants from Hungary (11.5%, a difference of 0.32%), Immigrants from Ukraine (11.5%, a difference of 0.41%), and Sudanese (11.5%, a difference of 0.44%).
| Demographics | Rating | Rank | Disability |
| Moroccans | 83.3 /100 | #143 | Excellent 11.5% |
| Australians | 82.5 /100 | #144 | Excellent 11.5% |
| Nigerians | 81.3 /100 | #145 | Excellent 11.5% |
| Immigrants | Hungary | 79.0 /100 | #146 | Good 11.5% |
| Immigrants | Ukraine | 77.6 /100 | #147 | Good 11.5% |
| Sudanese | 77.1 /100 | #148 | Good 11.5% |
| Immigrants | Norway | 73.2 /100 | #149 | Good 11.6% |
| Romanians | 72.7 /100 | #150 | Good 11.6% |
| Immigrants | Kenya | 72.1 /100 | #151 | Good 11.6% |
| Immigrants | Moldova | 72.0 /100 | #152 | Good 11.6% |
| Immigrants | Ghana | 71.2 /100 | #153 | Good 11.6% |
| Immigrants | Guatemala | 71.1 /100 | #154 | Good 11.6% |
| Immigrants | Netherlands | 69.8 /100 | #155 | Good 11.6% |
| Immigrants | Fiji | 69.5 /100 | #156 | Good 11.6% |
| Immigrants | Middle Africa | 69.5 /100 | #157 | Good 11.6% |
| Armenians | 65.9 /100 | #158 | Good 11.6% |
| Guatemalans | 65.1 /100 | #159 | Good 11.6% |
| Immigrants | Barbados | 64.2 /100 | #160 | Good 11.6% |
| Immigrants | Cuba | 62.8 /100 | #161 | Good 11.6% |
| Immigrants | Haiti | 59.2 /100 | #162 | Average 11.7% |
| Immigrants | Trinidad and Tobago | 58.9 /100 | #163 | Average 11.7% |