Palestinian vs Moroccan In Labor Force | Age 45-54
COMPARE
Palestinian
Moroccan
In Labor Force | Age 45-54
In Labor Force | Age 45-54 Comparison
Palestinians
Moroccans
83.3%
IN LABOR FORCE | AGE 45-54
94.8/ 100
METRIC RATING
97th/ 347
METRIC RANK
82.5%
IN LABOR FORCE | AGE 45-54
15.7/ 100
METRIC RATING
199th/ 347
METRIC RANK
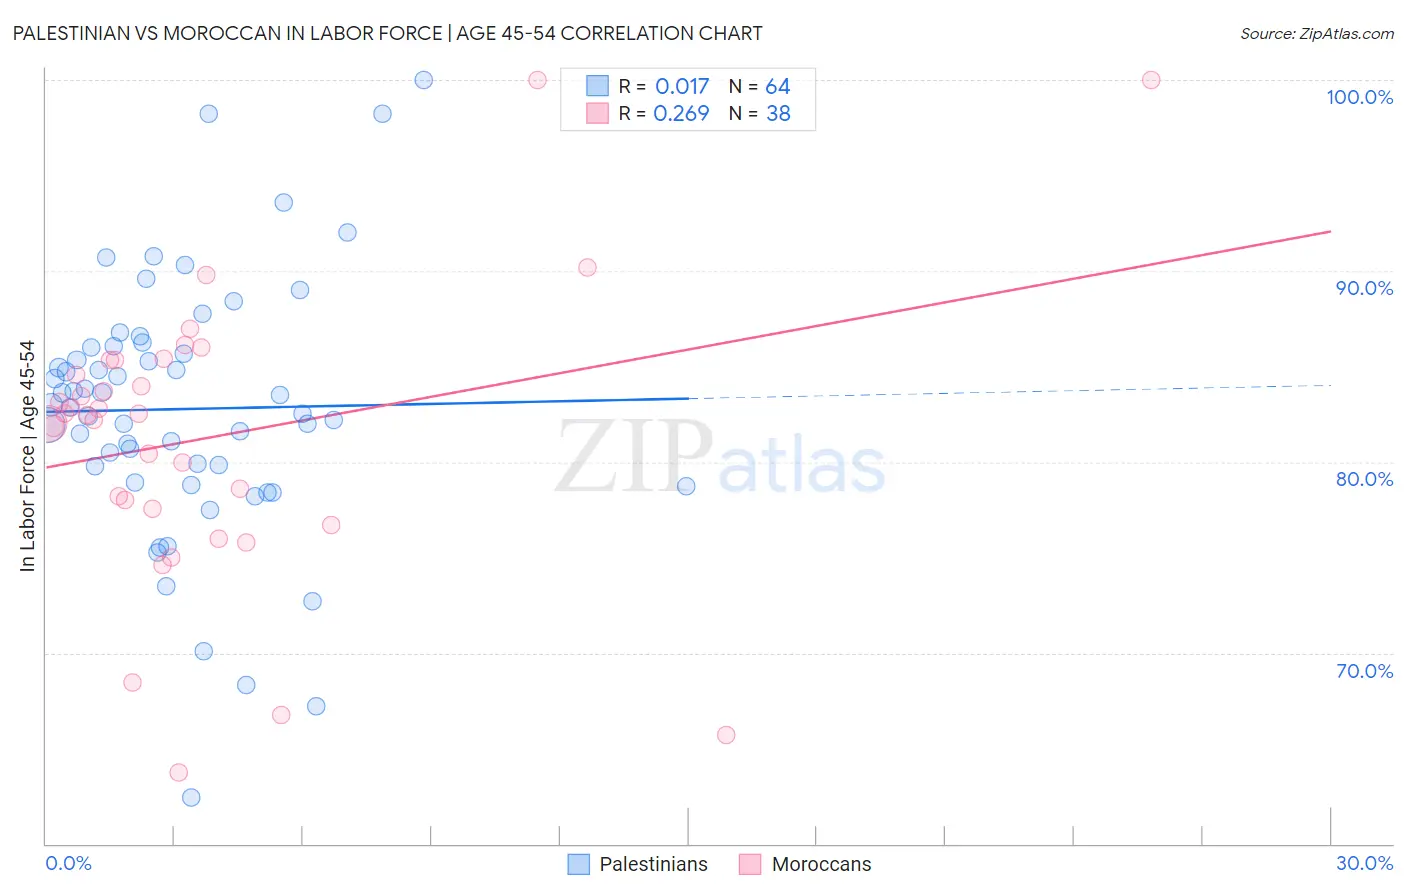
Palestinian vs Moroccan In Labor Force | Age 45-54 Correlation Chart
The statistical analysis conducted on geographies consisting of 216,394,682 people shows no correlation between the proportion of Palestinians and labor force participation rate among population between the ages 45 and 54 in the United States with a correlation coefficient (R) of 0.017 and weighted average of 83.3%. Similarly, the statistical analysis conducted on geographies consisting of 201,759,404 people shows a weak positive correlation between the proportion of Moroccans and labor force participation rate among population between the ages 45 and 54 in the United States with a correlation coefficient (R) of 0.269 and weighted average of 82.5%, a difference of 1.0%.
In Labor Force | Age 45-54 Correlation Summary
| Measurement | Palestinian | Moroccan |
| Minimum | 62.4% | 63.7% |
| Maximum | 100.0% | 100.0% |
| Range | 37.6% | 36.3% |
| Mean | 82.8% | 81.3% |
| Median | 82.9% | 82.5% |
| Interquartile 25% (IQ1) | 79.4% | 77.6% |
| Interquartile 75% (IQ3) | 86.0% | 85.3% |
| Interquartile Range (IQR) | 6.7% | 7.7% |
| Standard Deviation (Sample) | 6.9% | 7.6% |
| Standard Deviation (Population) | 6.8% | 7.5% |
Similar Demographics by In Labor Force | Age 45-54
Demographics Similar to Palestinians by In Labor Force | Age 45-54
In terms of in labor force | age 45-54, the demographic groups most similar to Palestinians are Immigrants from Argentina (83.3%, a difference of 0.0%), Immigrants from Kuwait (83.3%, a difference of 0.0%), Argentinean (83.3%, a difference of 0.010%), Maltese (83.3%, a difference of 0.010%), and Danish (83.3%, a difference of 0.020%).
| Demographics | Rating | Rank | In Labor Force | Age 45-54 |
| Immigrants | Japan | 95.5 /100 | #90 | Exceptional 83.3% |
| South Americans | 95.5 /100 | #91 | Exceptional 83.3% |
| Danes | 95.3 /100 | #92 | Exceptional 83.3% |
| Italians | 95.1 /100 | #93 | Exceptional 83.3% |
| Argentineans | 94.9 /100 | #94 | Exceptional 83.3% |
| Immigrants | Argentina | 94.9 /100 | #95 | Exceptional 83.3% |
| Immigrants | Kuwait | 94.8 /100 | #96 | Exceptional 83.3% |
| Palestinians | 94.8 /100 | #97 | Exceptional 83.3% |
| Maltese | 94.4 /100 | #98 | Exceptional 83.3% |
| Immigrants | Middle Africa | 94.3 /100 | #99 | Exceptional 83.3% |
| Mongolians | 94.2 /100 | #100 | Exceptional 83.3% |
| Immigrants | Belarus | 94.1 /100 | #101 | Exceptional 83.3% |
| Immigrants | Singapore | 93.9 /100 | #102 | Exceptional 83.3% |
| Albanians | 93.9 /100 | #103 | Exceptional 83.3% |
| Immigrants | Romania | 93.8 /100 | #104 | Exceptional 83.3% |
Demographics Similar to Moroccans by In Labor Force | Age 45-54
In terms of in labor force | age 45-54, the demographic groups most similar to Moroccans are French Canadian (82.5%, a difference of 0.0%), Canadian (82.4%, a difference of 0.010%), Immigrants from Western Asia (82.4%, a difference of 0.010%), Lebanese (82.5%, a difference of 0.040%), and Immigrants from Denmark (82.5%, a difference of 0.040%).
| Demographics | Rating | Rank | In Labor Force | Age 45-54 |
| Immigrants | Iraq | 20.9 /100 | #192 | Fair 82.5% |
| Australians | 20.8 /100 | #193 | Fair 82.5% |
| Immigrants | Norway | 20.7 /100 | #194 | Fair 82.5% |
| Immigrants | Canada | 20.0 /100 | #195 | Fair 82.5% |
| Immigrants | North America | 18.8 /100 | #196 | Poor 82.5% |
| Lebanese | 18.2 /100 | #197 | Poor 82.5% |
| Immigrants | Denmark | 17.9 /100 | #198 | Poor 82.5% |
| Moroccans | 15.7 /100 | #199 | Poor 82.5% |
| French Canadians | 15.4 /100 | #200 | Poor 82.5% |
| Canadians | 15.1 /100 | #201 | Poor 82.4% |
| Immigrants | Western Asia | 14.9 /100 | #202 | Poor 82.4% |
| Arabs | 11.6 /100 | #203 | Poor 82.4% |
| Immigrants | Western Europe | 10.9 /100 | #204 | Poor 82.4% |
| Senegalese | 9.5 /100 | #205 | Tragic 82.4% |
| Welsh | 9.2 /100 | #206 | Tragic 82.3% |