Immigrants from West Indies vs Moroccan Disability
COMPARE
Immigrants from West Indies
Moroccan
Disability
Disability Comparison
Immigrants from West Indies
Moroccans
11.9%
DISABILITY
21.1/ 100
METRIC RATING
190th/ 347
METRIC RANK
11.5%
DISABILITY
83.3/ 100
METRIC RATING
143rd/ 347
METRIC RANK
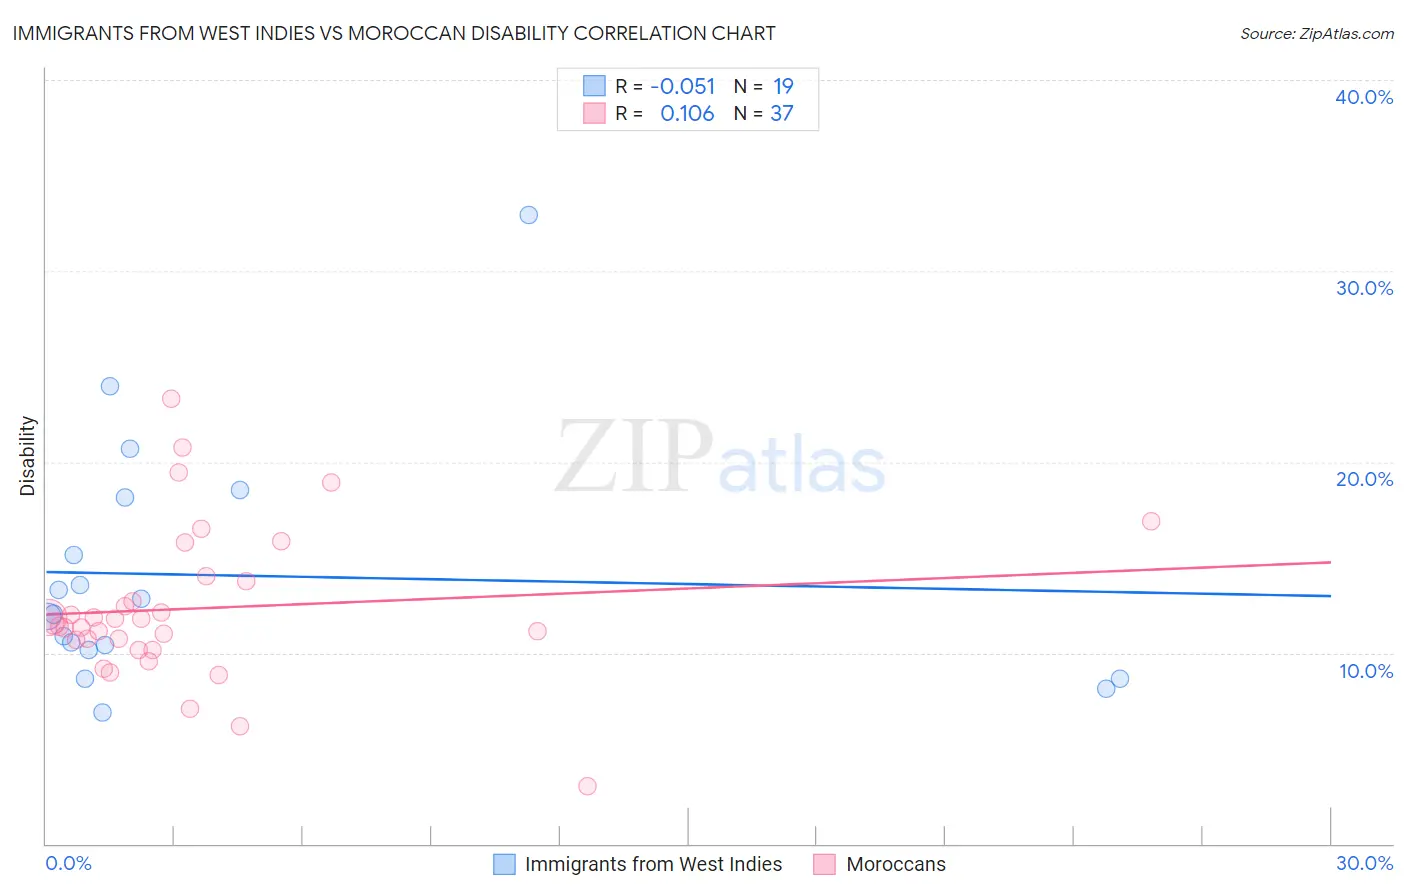
Immigrants from West Indies vs Moroccan Disability Correlation Chart
The statistical analysis conducted on geographies consisting of 72,456,461 people shows a slight negative correlation between the proportion of Immigrants from West Indies and percentage of population with a disability in the United States with a correlation coefficient (R) of -0.051 and weighted average of 11.9%. Similarly, the statistical analysis conducted on geographies consisting of 201,799,768 people shows a poor positive correlation between the proportion of Moroccans and percentage of population with a disability in the United States with a correlation coefficient (R) of 0.106 and weighted average of 11.5%, a difference of 3.3%.
Disability Correlation Summary
| Measurement | Immigrants from West Indies | Moroccan |
| Minimum | 6.9% | 3.0% |
| Maximum | 32.9% | 23.3% |
| Range | 26.0% | 20.3% |
| Mean | 14.1% | 12.3% |
| Median | 12.0% | 11.5% |
| Interquartile 25% (IQ1) | 10.1% | 10.4% |
| Interquartile 75% (IQ3) | 18.1% | 13.9% |
| Interquartile Range (IQR) | 8.0% | 3.5% |
| Standard Deviation (Sample) | 6.4% | 4.0% |
| Standard Deviation (Population) | 6.3% | 3.9% |
Similar Demographics by Disability
Demographics Similar to Immigrants from West Indies by Disability
In terms of disability, the demographic groups most similar to Immigrants from West Indies are Immigrants from Zaire (11.9%, a difference of 0.050%), Ute (11.9%, a difference of 0.11%), Lithuanian (11.9%, a difference of 0.16%), Immigrants from Mexico (11.9%, a difference of 0.17%), and Immigrants from Bosnia and Herzegovina (11.9%, a difference of 0.21%).
| Demographics | Rating | Rank | Disability |
| Hondurans | 31.2 /100 | #183 | Fair 11.8% |
| Iraqis | 30.0 /100 | #184 | Fair 11.8% |
| Immigrants | Burma/Myanmar | 28.5 /100 | #185 | Fair 11.8% |
| Immigrants | Scotland | 28.2 /100 | #186 | Fair 11.8% |
| Lebanese | 27.9 /100 | #187 | Fair 11.8% |
| Immigrants | Mexico | 23.8 /100 | #188 | Fair 11.9% |
| Immigrants | Zaire | 21.8 /100 | #189 | Fair 11.9% |
| Immigrants | West Indies | 21.1 /100 | #190 | Fair 11.9% |
| Ute | 19.5 /100 | #191 | Poor 11.9% |
| Lithuanians | 18.8 /100 | #192 | Poor 11.9% |
| Immigrants | Bosnia and Herzegovina | 18.0 /100 | #193 | Poor 11.9% |
| Somalis | 17.3 /100 | #194 | Poor 11.9% |
| Barbadians | 15.8 /100 | #195 | Poor 11.9% |
| Serbians | 15.4 /100 | #196 | Poor 11.9% |
| Immigrants | Belize | 15.2 /100 | #197 | Poor 11.9% |
Demographics Similar to Moroccans by Disability
In terms of disability, the demographic groups most similar to Moroccans are Australian (11.5%, a difference of 0.070%), Nigerian (11.5%, a difference of 0.15%), Immigrants from Sudan (11.5%, a difference of 0.17%), Immigrants from Grenada (11.5%, a difference of 0.25%), and Russian (11.5%, a difference of 0.31%).
| Demographics | Rating | Rank | Disability |
| Immigrants | St. Vincent and the Grenadines | 87.8 /100 | #136 | Excellent 11.4% |
| Kenyans | 87.1 /100 | #137 | Excellent 11.5% |
| New Zealanders | 87.0 /100 | #138 | Excellent 11.5% |
| Ghanaians | 87.0 /100 | #139 | Excellent 11.5% |
| Russians | 86.8 /100 | #140 | Excellent 11.5% |
| Immigrants | Grenada | 86.1 /100 | #141 | Excellent 11.5% |
| Immigrants | Sudan | 85.3 /100 | #142 | Excellent 11.5% |
| Moroccans | 83.3 /100 | #143 | Excellent 11.5% |
| Australians | 82.5 /100 | #144 | Excellent 11.5% |
| Nigerians | 81.3 /100 | #145 | Excellent 11.5% |
| Immigrants | Hungary | 79.0 /100 | #146 | Good 11.5% |
| Immigrants | Ukraine | 77.6 /100 | #147 | Good 11.5% |
| Sudanese | 77.1 /100 | #148 | Good 11.5% |
| Immigrants | Norway | 73.2 /100 | #149 | Good 11.6% |
| Romanians | 72.7 /100 | #150 | Good 11.6% |