Honduran vs Immigrants from Philippines Ambulatory Disability
COMPARE
Honduran
Immigrants from Philippines
Ambulatory Disability
Ambulatory Disability Comparison
Hondurans
Immigrants from Philippines
6.3%
AMBULATORY DISABILITY
6.3/ 100
METRIC RATING
225th/ 347
METRIC RANK
6.0%
AMBULATORY DISABILITY
83.0/ 100
METRIC RATING
142nd/ 347
METRIC RANK
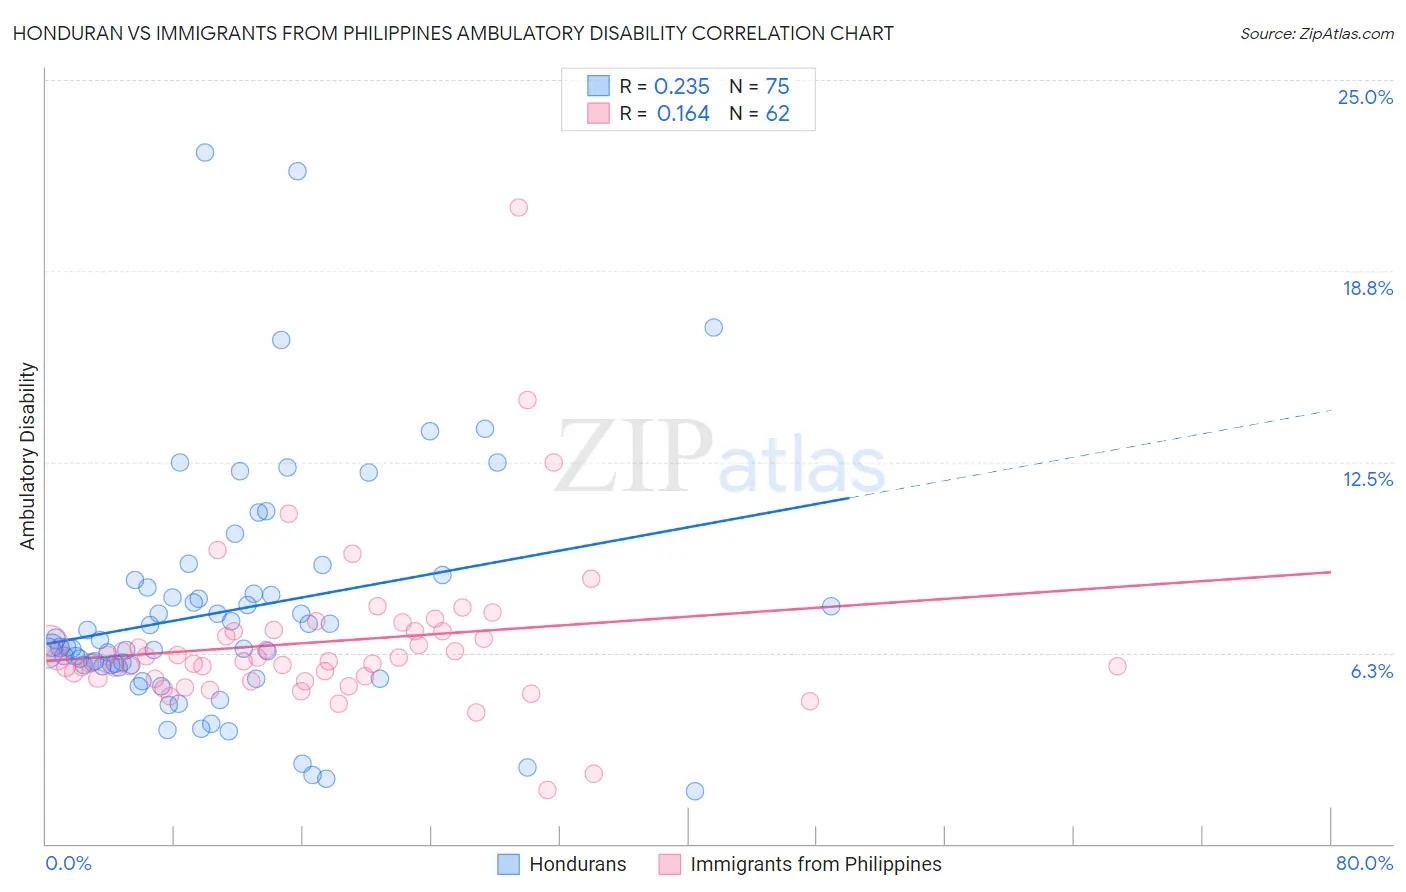
Honduran vs Immigrants from Philippines Ambulatory Disability Correlation Chart
The statistical analysis conducted on geographies consisting of 357,719,276 people shows a weak positive correlation between the proportion of Hondurans and percentage of population with ambulatory disability in the United States with a correlation coefficient (R) of 0.235 and weighted average of 6.3%. Similarly, the statistical analysis conducted on geographies consisting of 471,065,462 people shows a poor positive correlation between the proportion of Immigrants from Philippines and percentage of population with ambulatory disability in the United States with a correlation coefficient (R) of 0.164 and weighted average of 6.0%, a difference of 5.8%.
Ambulatory Disability Correlation Summary
| Measurement | Honduran | Immigrants from Philippines |
| Minimum | 1.7% | 1.8% |
| Maximum | 22.6% | 20.8% |
| Range | 20.9% | 19.1% |
| Mean | 7.6% | 6.6% |
| Median | 6.4% | 6.0% |
| Interquartile 25% (IQ1) | 5.8% | 5.4% |
| Interquartile 75% (IQ3) | 8.4% | 7.0% |
| Interquartile Range (IQR) | 2.6% | 1.5% |
| Standard Deviation (Sample) | 3.9% | 2.7% |
| Standard Deviation (Population) | 3.9% | 2.7% |
Similar Demographics by Ambulatory Disability
Demographics Similar to Hondurans by Ambulatory Disability
In terms of ambulatory disability, the demographic groups most similar to Hondurans are Liberian (6.3%, a difference of 0.17%), Immigrants from Honduras (6.3%, a difference of 0.27%), Slavic (6.4%, a difference of 0.27%), German Russian (6.3%, a difference of 0.56%), and Hungarian (6.3%, a difference of 0.59%).
| Demographics | Rating | Rank | Ambulatory Disability |
| Guamanians/Chamorros | 10.6 /100 | #218 | Poor 6.3% |
| Indonesians | 9.9 /100 | #219 | Tragic 6.3% |
| Immigrants | Albania | 9.6 /100 | #220 | Tragic 6.3% |
| Hungarians | 9.6 /100 | #221 | Tragic 6.3% |
| German Russians | 9.4 /100 | #222 | Tragic 6.3% |
| Immigrants | Honduras | 7.6 /100 | #223 | Tragic 6.3% |
| Liberians | 7.1 /100 | #224 | Tragic 6.3% |
| Hondurans | 6.3 /100 | #225 | Tragic 6.3% |
| Slavs | 5.1 /100 | #226 | Tragic 6.4% |
| Cubans | 4.0 /100 | #227 | Tragic 6.4% |
| Portuguese | 4.0 /100 | #228 | Tragic 6.4% |
| Czechoslovakians | 3.8 /100 | #229 | Tragic 6.4% |
| Mexicans | 3.5 /100 | #230 | Tragic 6.4% |
| Panamanians | 3.1 /100 | #231 | Tragic 6.4% |
| Assyrians/Chaldeans/Syriacs | 2.4 /100 | #232 | Tragic 6.4% |
Demographics Similar to Immigrants from Philippines by Ambulatory Disability
In terms of ambulatory disability, the demographic groups most similar to Immigrants from Philippines are Swedish (6.0%, a difference of 0.010%), Romanian (6.0%, a difference of 0.010%), Macedonian (6.0%, a difference of 0.020%), Czech (6.0%, a difference of 0.030%), and Pakistani (6.0%, a difference of 0.050%).
| Demographics | Rating | Rank | Ambulatory Disability |
| Immigrants | Italy | 85.0 /100 | #135 | Excellent 6.0% |
| Immigrants | North Macedonia | 84.1 /100 | #136 | Excellent 6.0% |
| Immigrants | Syria | 84.1 /100 | #137 | Excellent 6.0% |
| Immigrants | Hungary | 83.9 /100 | #138 | Excellent 6.0% |
| Immigrants | Zaire | 83.6 /100 | #139 | Excellent 6.0% |
| Czechs | 83.3 /100 | #140 | Excellent 6.0% |
| Swedes | 83.1 /100 | #141 | Excellent 6.0% |
| Immigrants | Philippines | 83.0 /100 | #142 | Excellent 6.0% |
| Romanians | 82.9 /100 | #143 | Excellent 6.0% |
| Macedonians | 82.8 /100 | #144 | Excellent 6.0% |
| Pakistanis | 82.5 /100 | #145 | Excellent 6.0% |
| Immigrants | Greece | 82.5 /100 | #146 | Excellent 6.0% |
| Immigrants | Moldova | 82.4 /100 | #147 | Excellent 6.0% |
| Immigrants | Eastern Europe | 82.0 /100 | #148 | Excellent 6.0% |
| Lithuanians | 81.9 /100 | #149 | Excellent 6.0% |