Estonian vs Immigrants from Philippines Ambulatory Disability
COMPARE
Estonian
Immigrants from Philippines
Ambulatory Disability
Ambulatory Disability Comparison
Estonians
Immigrants from Philippines
5.9%
AMBULATORY DISABILITY
92.9/ 100
METRIC RATING
120th/ 347
METRIC RANK
6.0%
AMBULATORY DISABILITY
83.0/ 100
METRIC RATING
142nd/ 347
METRIC RANK
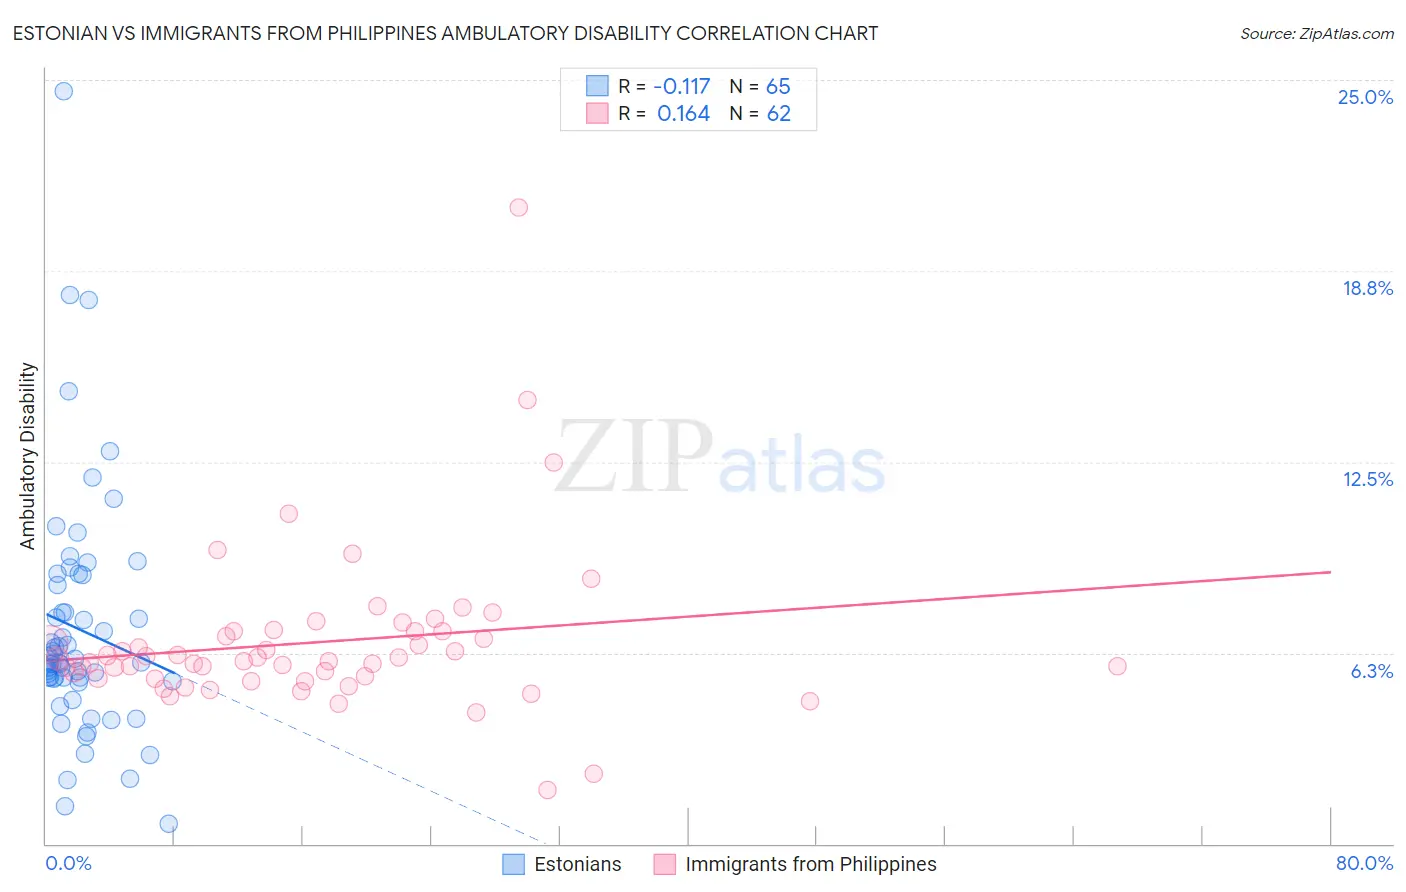
Estonian vs Immigrants from Philippines Ambulatory Disability Correlation Chart
The statistical analysis conducted on geographies consisting of 123,516,931 people shows a poor negative correlation between the proportion of Estonians and percentage of population with ambulatory disability in the United States with a correlation coefficient (R) of -0.117 and weighted average of 5.9%. Similarly, the statistical analysis conducted on geographies consisting of 471,065,462 people shows a poor positive correlation between the proportion of Immigrants from Philippines and percentage of population with ambulatory disability in the United States with a correlation coefficient (R) of 0.164 and weighted average of 6.0%, a difference of 1.3%.
Ambulatory Disability Correlation Summary
| Measurement | Estonian | Immigrants from Philippines |
| Minimum | 0.64% | 1.8% |
| Maximum | 24.6% | 20.8% |
| Range | 24.0% | 19.1% |
| Mean | 7.0% | 6.6% |
| Median | 5.9% | 6.0% |
| Interquartile 25% (IQ1) | 5.4% | 5.4% |
| Interquartile 75% (IQ3) | 8.6% | 7.0% |
| Interquartile Range (IQR) | 3.3% | 1.5% |
| Standard Deviation (Sample) | 4.0% | 2.7% |
| Standard Deviation (Population) | 3.9% | 2.7% |
Similar Demographics by Ambulatory Disability
Demographics Similar to Estonians by Ambulatory Disability
In terms of ambulatory disability, the demographic groups most similar to Estonians are Norwegian (5.9%, a difference of 0.040%), Costa Rican (5.9%, a difference of 0.070%), Icelander (5.9%, a difference of 0.070%), Immigrants from Russia (5.9%, a difference of 0.10%), and Russian (5.9%, a difference of 0.11%).
| Demographics | Rating | Rank | Ambulatory Disability |
| Immigrants | Uruguay | 95.6 /100 | #113 | Exceptional 5.9% |
| Immigrants | Poland | 95.4 /100 | #114 | Exceptional 5.9% |
| South American Indians | 94.8 /100 | #115 | Exceptional 5.9% |
| Immigrants | Africa | 94.7 /100 | #116 | Exceptional 5.9% |
| Immigrants | South Eastern Asia | 93.6 /100 | #117 | Exceptional 5.9% |
| Russians | 93.4 /100 | #118 | Exceptional 5.9% |
| Norwegians | 93.1 /100 | #119 | Exceptional 5.9% |
| Estonians | 92.9 /100 | #120 | Exceptional 5.9% |
| Costa Ricans | 92.6 /100 | #121 | Exceptional 5.9% |
| Icelanders | 92.6 /100 | #122 | Exceptional 5.9% |
| Immigrants | Russia | 92.4 /100 | #123 | Exceptional 5.9% |
| Immigrants | Middle Africa | 92.2 /100 | #124 | Exceptional 5.9% |
| Koreans | 91.6 /100 | #125 | Exceptional 5.9% |
| Arabs | 91.5 /100 | #126 | Exceptional 5.9% |
| Immigrants | Nigeria | 90.9 /100 | #127 | Exceptional 5.9% |
Demographics Similar to Immigrants from Philippines by Ambulatory Disability
In terms of ambulatory disability, the demographic groups most similar to Immigrants from Philippines are Swedish (6.0%, a difference of 0.010%), Romanian (6.0%, a difference of 0.010%), Macedonian (6.0%, a difference of 0.020%), Czech (6.0%, a difference of 0.030%), and Pakistani (6.0%, a difference of 0.050%).
| Demographics | Rating | Rank | Ambulatory Disability |
| Immigrants | Italy | 85.0 /100 | #135 | Excellent 6.0% |
| Immigrants | North Macedonia | 84.1 /100 | #136 | Excellent 6.0% |
| Immigrants | Syria | 84.1 /100 | #137 | Excellent 6.0% |
| Immigrants | Hungary | 83.9 /100 | #138 | Excellent 6.0% |
| Immigrants | Zaire | 83.6 /100 | #139 | Excellent 6.0% |
| Czechs | 83.3 /100 | #140 | Excellent 6.0% |
| Swedes | 83.1 /100 | #141 | Excellent 6.0% |
| Immigrants | Philippines | 83.0 /100 | #142 | Excellent 6.0% |
| Romanians | 82.9 /100 | #143 | Excellent 6.0% |
| Macedonians | 82.8 /100 | #144 | Excellent 6.0% |
| Pakistanis | 82.5 /100 | #145 | Excellent 6.0% |
| Immigrants | Greece | 82.5 /100 | #146 | Excellent 6.0% |
| Immigrants | Moldova | 82.4 /100 | #147 | Excellent 6.0% |
| Immigrants | Eastern Europe | 82.0 /100 | #148 | Excellent 6.0% |
| Lithuanians | 81.9 /100 | #149 | Excellent 6.0% |