Ottawa vs Immigrants from Philippines 12th Grade, No Diploma
COMPARE
Ottawa
Immigrants from Philippines
12th Grade, No Diploma
12th Grade, No Diploma Comparison
Ottawa
Immigrants from Philippines
91.9%
12TH GRADE, NO DIPLOMA
93.1/ 100
METRIC RATING
122nd/ 347
METRIC RANK
90.2%
12TH GRADE, NO DIPLOMA
2.8/ 100
METRIC RATING
230th/ 347
METRIC RANK
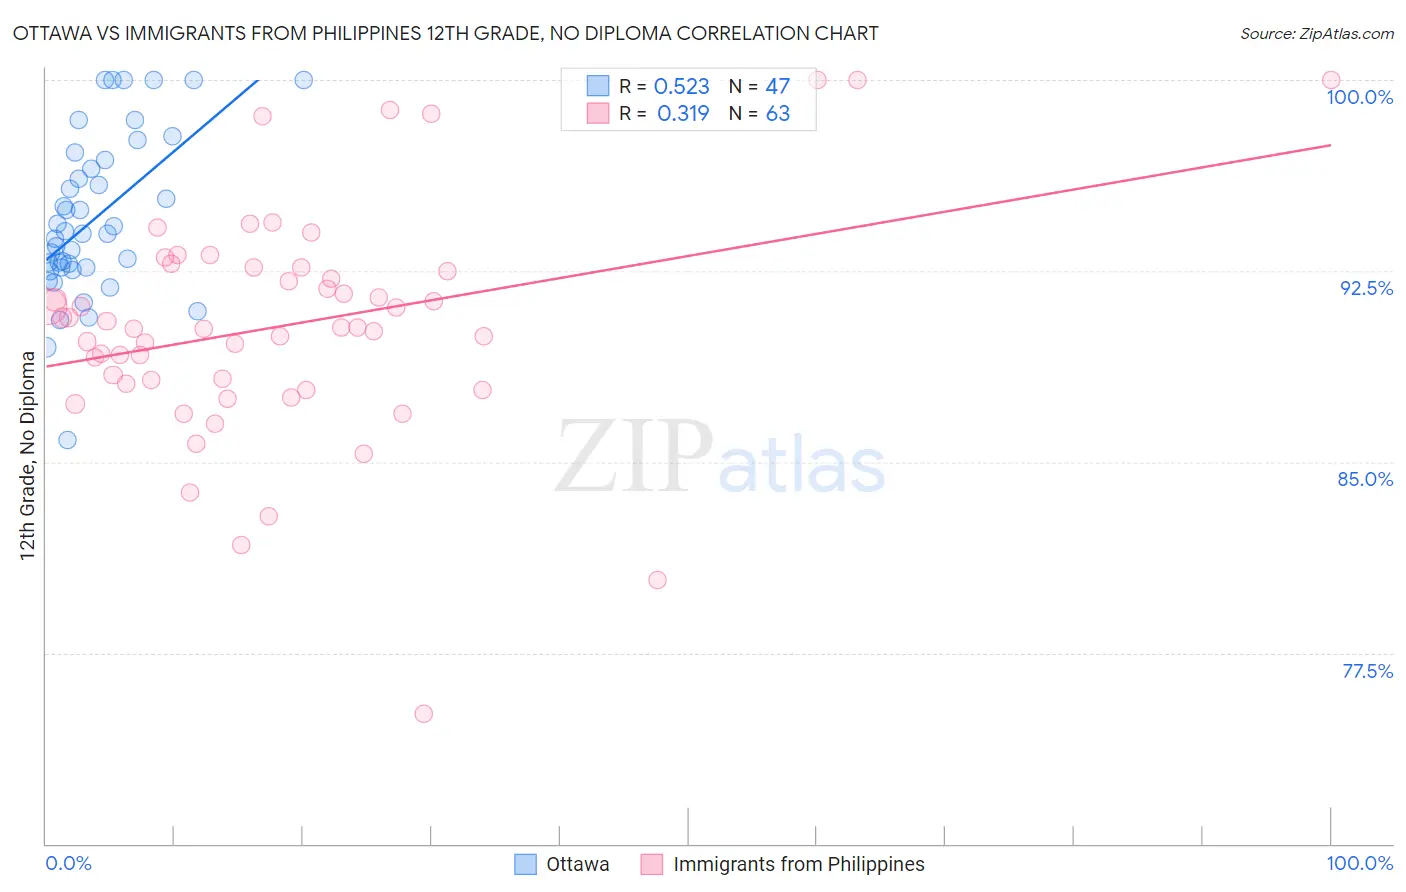
Ottawa vs Immigrants from Philippines 12th Grade, No Diploma Correlation Chart
The statistical analysis conducted on geographies consisting of 49,956,602 people shows a substantial positive correlation between the proportion of Ottawa and percentage of population with at least 12th grade (no diploma) education in the United States with a correlation coefficient (R) of 0.523 and weighted average of 91.9%. Similarly, the statistical analysis conducted on geographies consisting of 471,300,535 people shows a mild positive correlation between the proportion of Immigrants from Philippines and percentage of population with at least 12th grade (no diploma) education in the United States with a correlation coefficient (R) of 0.319 and weighted average of 90.2%, a difference of 1.9%.
12th Grade, No Diploma Correlation Summary
| Measurement | Ottawa | Immigrants from Philippines |
| Minimum | 85.8% | 75.1% |
| Maximum | 100.0% | 100.0% |
| Range | 14.2% | 24.9% |
| Mean | 94.6% | 90.4% |
| Median | 94.0% | 90.3% |
| Interquartile 25% (IQ1) | 92.6% | 88.1% |
| Interquartile 75% (IQ3) | 96.9% | 92.6% |
| Interquartile Range (IQR) | 4.2% | 4.6% |
| Standard Deviation (Sample) | 3.2% | 4.5% |
| Standard Deviation (Population) | 3.1% | 4.5% |
Similar Demographics by 12th Grade, No Diploma
Demographics Similar to Ottawa by 12th Grade, No Diploma
In terms of 12th grade, no diploma, the demographic groups most similar to Ottawa are Menominee (91.9%, a difference of 0.020%), Egyptian (91.9%, a difference of 0.030%), Immigrants from Kazakhstan (91.9%, a difference of 0.050%), Immigrants from Ukraine (91.8%, a difference of 0.070%), and White/Caucasian (91.8%, a difference of 0.070%).
| Demographics | Rating | Rank | 12th Grade, No Diploma |
| Immigrants | Sri Lanka | 96.4 /100 | #115 | Exceptional 92.1% |
| Aleuts | 96.3 /100 | #116 | Exceptional 92.1% |
| Immigrants | Eastern Europe | 96.3 /100 | #117 | Exceptional 92.1% |
| Puget Sound Salish | 95.8 /100 | #118 | Exceptional 92.0% |
| Immigrants | Germany | 95.5 /100 | #119 | Exceptional 92.0% |
| Immigrants | Kazakhstan | 94.2 /100 | #120 | Exceptional 91.9% |
| Menominee | 93.5 /100 | #121 | Exceptional 91.9% |
| Ottawa | 93.1 /100 | #122 | Exceptional 91.9% |
| Egyptians | 92.5 /100 | #123 | Exceptional 91.9% |
| Immigrants | Ukraine | 91.6 /100 | #124 | Exceptional 91.8% |
| Whites/Caucasians | 91.6 /100 | #125 | Exceptional 91.8% |
| Basques | 91.3 /100 | #126 | Exceptional 91.8% |
| Immigrants | Jordan | 91.0 /100 | #127 | Exceptional 91.8% |
| Mongolians | 89.9 /100 | #128 | Excellent 91.8% |
| German Russians | 89.8 /100 | #129 | Excellent 91.8% |
Demographics Similar to Immigrants from Philippines by 12th Grade, No Diploma
In terms of 12th grade, no diploma, the demographic groups most similar to Immigrants from Philippines are Peruvian (90.2%, a difference of 0.010%), Blackfeet (90.1%, a difference of 0.050%), Immigrants from Thailand (90.1%, a difference of 0.070%), Immigrants from South America (90.1%, a difference of 0.070%), and Colville (90.1%, a difference of 0.070%).
| Demographics | Rating | Rank | 12th Grade, No Diploma |
| South Americans | 5.0 /100 | #223 | Tragic 90.3% |
| Immigrants | Panama | 4.8 /100 | #224 | Tragic 90.3% |
| Chickasaw | 4.8 /100 | #225 | Tragic 90.3% |
| Immigrants | Zaire | 4.6 /100 | #226 | Tragic 90.3% |
| Nigerians | 4.5 /100 | #227 | Tragic 90.3% |
| Creek | 3.9 /100 | #228 | Tragic 90.3% |
| Immigrants | Bahamas | 3.6 /100 | #229 | Tragic 90.2% |
| Immigrants | Philippines | 2.8 /100 | #230 | Tragic 90.2% |
| Peruvians | 2.7 /100 | #231 | Tragic 90.2% |
| Blackfeet | 2.4 /100 | #232 | Tragic 90.1% |
| Immigrants | Thailand | 2.3 /100 | #233 | Tragic 90.1% |
| Immigrants | South America | 2.3 /100 | #234 | Tragic 90.1% |
| Colville | 2.3 /100 | #235 | Tragic 90.1% |
| Immigrants | Uzbekistan | 2.2 /100 | #236 | Tragic 90.1% |
| Immigrants | Colombia | 2.1 /100 | #237 | Tragic 90.1% |