Cape Verdean vs Immigrants from Philippines Ambulatory Disability
COMPARE
Cape Verdean
Immigrants from Philippines
Ambulatory Disability
Ambulatory Disability Comparison
Cape Verdeans
Immigrants from Philippines
6.9%
AMBULATORY DISABILITY
0.0/ 100
METRIC RATING
294th/ 347
METRIC RANK
6.0%
AMBULATORY DISABILITY
83.0/ 100
METRIC RATING
142nd/ 347
METRIC RANK
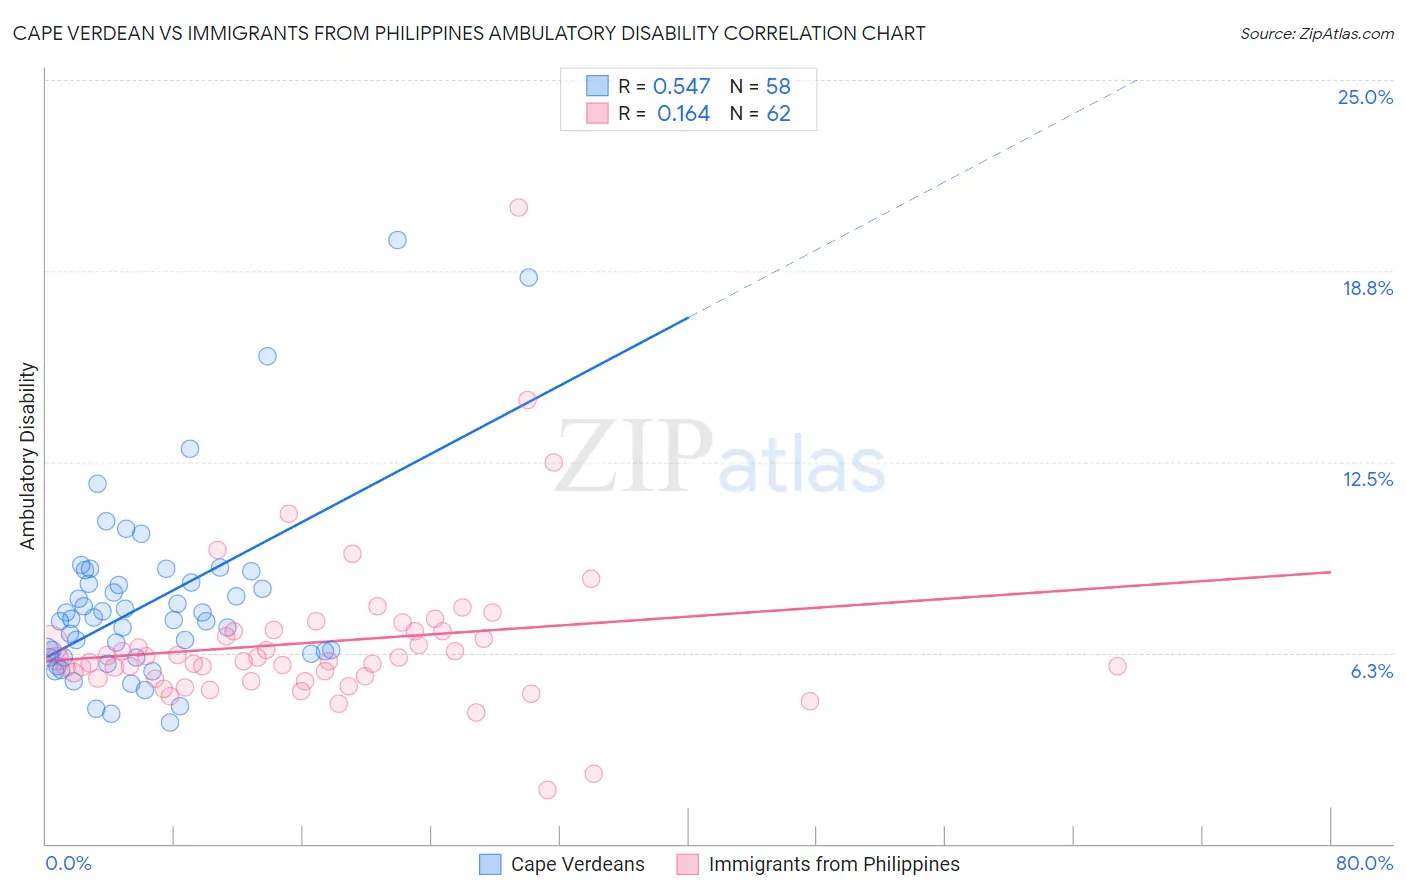
Cape Verdean vs Immigrants from Philippines Ambulatory Disability Correlation Chart
The statistical analysis conducted on geographies consisting of 107,569,251 people shows a substantial positive correlation between the proportion of Cape Verdeans and percentage of population with ambulatory disability in the United States with a correlation coefficient (R) of 0.547 and weighted average of 6.9%. Similarly, the statistical analysis conducted on geographies consisting of 471,065,462 people shows a poor positive correlation between the proportion of Immigrants from Philippines and percentage of population with ambulatory disability in the United States with a correlation coefficient (R) of 0.164 and weighted average of 6.0%, a difference of 15.3%.
Ambulatory Disability Correlation Summary
| Measurement | Cape Verdean | Immigrants from Philippines |
| Minimum | 4.0% | 1.8% |
| Maximum | 19.8% | 20.8% |
| Range | 15.8% | 19.1% |
| Mean | 7.9% | 6.6% |
| Median | 7.3% | 6.0% |
| Interquartile 25% (IQ1) | 6.1% | 5.4% |
| Interquartile 75% (IQ3) | 8.6% | 7.0% |
| Interquartile Range (IQR) | 2.5% | 1.5% |
| Standard Deviation (Sample) | 3.0% | 2.7% |
| Standard Deviation (Population) | 3.0% | 2.7% |
Similar Demographics by Ambulatory Disability
Demographics Similar to Cape Verdeans by Ambulatory Disability
In terms of ambulatory disability, the demographic groups most similar to Cape Verdeans are Crow (6.9%, a difference of 0.070%), Immigrants from St. Vincent and the Grenadines (6.9%, a difference of 0.19%), Alaskan Athabascan (6.9%, a difference of 0.30%), Cheyenne (6.9%, a difference of 0.42%), and French American Indian (6.9%, a difference of 0.47%).
| Demographics | Rating | Rank | Ambulatory Disability |
| U.S. Virgin Islanders | 0.0 /100 | #287 | Tragic 6.8% |
| Immigrants | Nonimmigrants | 0.0 /100 | #288 | Tragic 6.9% |
| Immigrants | Dominica | 0.0 /100 | #289 | Tragic 6.9% |
| Scotch-Irish | 0.0 /100 | #290 | Tragic 6.9% |
| West Indians | 0.0 /100 | #291 | Tragic 6.9% |
| Cheyenne | 0.0 /100 | #292 | Tragic 6.9% |
| Immigrants | St. Vincent and the Grenadines | 0.0 /100 | #293 | Tragic 6.9% |
| Cape Verdeans | 0.0 /100 | #294 | Tragic 6.9% |
| Crow | 0.0 /100 | #295 | Tragic 6.9% |
| Alaskan Athabascans | 0.0 /100 | #296 | Tragic 6.9% |
| French American Indians | 0.0 /100 | #297 | Tragic 6.9% |
| Immigrants | Grenada | 0.0 /100 | #298 | Tragic 6.9% |
| Puget Sound Salish | 0.0 /100 | #299 | Tragic 6.9% |
| Marshallese | 0.0 /100 | #300 | Tragic 6.9% |
| British West Indians | 0.0 /100 | #301 | Tragic 7.0% |
Demographics Similar to Immigrants from Philippines by Ambulatory Disability
In terms of ambulatory disability, the demographic groups most similar to Immigrants from Philippines are Swedish (6.0%, a difference of 0.010%), Romanian (6.0%, a difference of 0.010%), Macedonian (6.0%, a difference of 0.020%), Czech (6.0%, a difference of 0.030%), and Pakistani (6.0%, a difference of 0.050%).
| Demographics | Rating | Rank | Ambulatory Disability |
| Immigrants | Italy | 85.0 /100 | #135 | Excellent 6.0% |
| Immigrants | North Macedonia | 84.1 /100 | #136 | Excellent 6.0% |
| Immigrants | Syria | 84.1 /100 | #137 | Excellent 6.0% |
| Immigrants | Hungary | 83.9 /100 | #138 | Excellent 6.0% |
| Immigrants | Zaire | 83.6 /100 | #139 | Excellent 6.0% |
| Czechs | 83.3 /100 | #140 | Excellent 6.0% |
| Swedes | 83.1 /100 | #141 | Excellent 6.0% |
| Immigrants | Philippines | 83.0 /100 | #142 | Excellent 6.0% |
| Romanians | 82.9 /100 | #143 | Excellent 6.0% |
| Macedonians | 82.8 /100 | #144 | Excellent 6.0% |
| Pakistanis | 82.5 /100 | #145 | Excellent 6.0% |
| Immigrants | Greece | 82.5 /100 | #146 | Excellent 6.0% |
| Immigrants | Moldova | 82.4 /100 | #147 | Excellent 6.0% |
| Immigrants | Eastern Europe | 82.0 /100 | #148 | Excellent 6.0% |
| Lithuanians | 81.9 /100 | #149 | Excellent 6.0% |